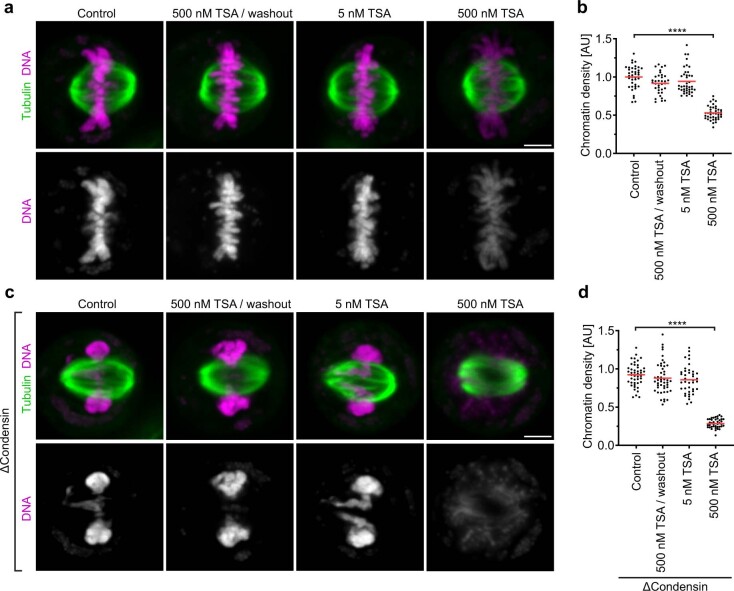
Extended Data Fig. 4. Effect of various TSA treatments on mitotic chromosome organization.
a,b, Mitotic chromosome morphology and DNA density after various TSA treatment conditions. a, Live HeLa cells stained with Hoechst 33342 and SiR-tubulin were analysed without perturbations (control), after 3 h treatment with 500 nM TSA followed by 8 h removal of TSA (500 nM TSA/washout), or after 3 h treatment with 5 nM or 500 nM TSA, as indicated. Mitotic cells were identified based on their rounded morphology and the presence of a bipolar spindle. Z-projection of 4 Z-sections with Z-offset of 0.25 µm. b, Quantification of DNA density in mitotic chromatin for cells as shown in a. Data normalized to mean of control mitotic cells. n = 39 cells for control, n = 35 for TSA washout, n = 40 for 5 nM TSA and n = 40 for 500 nM TSA. Bars indicate mean, significance was tested by a two-tailed Mann-Whitney test (P<10−15, precision limit of floating-point arithmetic). c,d, Mitotic chromosome morphology and DNA density in condensin-depleted cells, in various TSA treatment conditions. HeLa cells with homozygous Smc4-mAID-Halo alleles and stably expressing OsTIR(F74G) were treated with 5-PhIAA for 3 h to degrade Smc4 (ΔCondensin). c, Live cells stained with Hoechst 33342 and SiR-tubulin were analysed without additional perturbations (control), after 3 h treatment with 500 nM TSA followed by 8 h removal of TSA (500 nM TSA/washout), or after 3 h treatment with 5 nM or 500 nM TSA, as indicated. Mitotic cells were identified based on their rounded morphology and the presence of a bipolar spindle. Z-projection of 4 confocal slices with Z-offset of 0.25 µm. d, Quantification of DNA density in mitotic chromatin for cells as shown in c. Data normalized to mean of control mitotic cells. n = 45 cells for control, n = 47 for TSA washout, n = 40 for 5 nM TSA and n = 40 for 500 nM TSA. Bars indicate mean, significance was tested by a two-tailed Mann-Whitney test (P<10−15, precision limit of floating-point arithmetic). Biological replicates: n = 2 (a–d). Scale bars, 5 µm.

