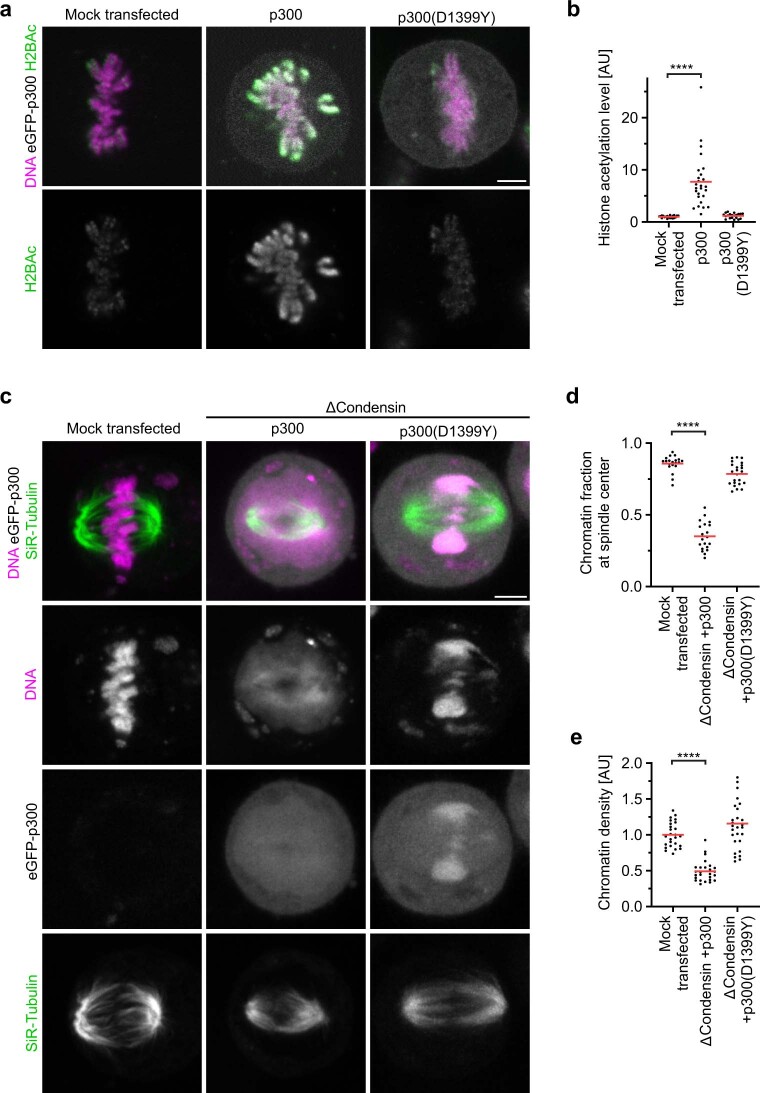
Extended Data Fig. 5. Histone acetylation and chromosome organization in cells overexpressing eGFP-p300.
a, b, Immunofluorescence analysis of histone acetylation in mitotic cells overexpressing p300 histone acetyltransferase or catalytically dead p300(D1399Y). a, Cells were transfected with a plasmid coding for eGFP-p300 or eGFP-p300(D1399Y) as indicated and fixed after 48 h. Histone 2B acetylation was analysed by immunofluorescence. DNA was stained with Hoechst 33342. b, Quantification of histone acetylation in metaphase cells as in a. Data points were normalized to the mean of mock-transfected mitotic cells. n = 20 for mock-transfected, n=26 for p300, n = 20 for p300(D1399Y). Bars indicate mean; significance was tested by a two-tailed Mann-Whitney test (P = 3.57x10⁻¹³). c–e, Analysis of chromatin density and chromosome congression to the spindle centre in cells after SMC4-AID-Halo degradation (ΔCondensin) and overexpression of p300 or catalytically dead p300(D1399Y). c, Cells were transfected with a plasmid coding for eGFP-p300 or eGFP-p300(D1399Y) as indicated and analysed by live-cell imaging after 48 h. DNA was stained with Hoechst 33342 and microtubules stained by SiR-Tubulin to identify mitotic cells with bipolar spindles. Projection of 5 Z-sections. d, Quantification of chromosome congression by the fraction of chromatin localizing to the central spindle region. n = 20 for mock-transfected, n = 24 for ΔCondensin+p300, n=20 for ΔCondensin+p300(D1399Y). Bars indicate mean; significance was tested by a two-tailed Mann-Whitney test (P = 1.451x10⁻¹¹). e, Quantification of chromatin density in cells treated as in c. n = 20 for mock-transfected, n = 24 for ΔCondensin+p300, n = 20 for ΔCondensin+p300(D1399Y). Bars indicate mean; significance was tested by a two-tailed Mann-Whitney test (P = 7.86x10⁻¹³). Biological replicates: n = 2 (a,b); n = 3 (c–e). Scale bars, 5 µm.

