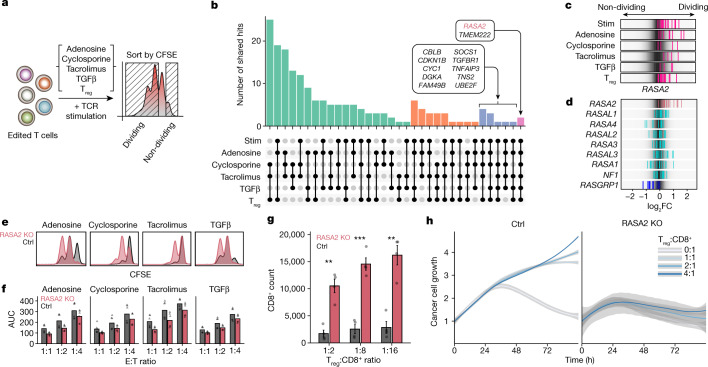
Fig. 1. Multiple genome-wide CRISPR screens in primary human T cells identify RASA2 as a modulator of resistance to immunosuppressive conditions.
a, Schematic of genome-wide screens for resistance gene targets in human T cells. b, Top shared gene hits (z-score >1.5) between 5 (blue) and all 6 (pink) of the screens are labelled. Bar height is the number of shared genes among the screens, connected by dots in the lower panel (n = 4 human donors for stimulated (stim) and Treg cell screens, n = 2 for adenosine, cyclosporine and tacrolimus, and n = 1 for the TGFβ screen). c,d, log2 fold change (FC) for individual guide RNAs (vertical lines); background shows the overall guide distribution in greyscale. c, Guides targeting RASA2 (pink) across all suppressive conditions. d, Guides targeting RasGAP family members other than RASA2 were not enriched consistently in either direction, whereas guides targeting the RasGEF RASGRP1 were depleted from dividing cells as expected. e, Distribution of CFSE staining in RASA2-KO versus control (Ctrl; non-targeting guide RNA) T cells across all suppressive conditions. f, Cancer cell growth during in vitro cancer cell-killing assay under suppressive conditions. AUC, area under the growth curve. n = 2 donors in triplicate, shape denotes donor. g, Suppression assay confirms that RASA2 ablation rendered T cells resistant to Treg cell suppression of proliferation in vitro. Bars show the CD8+ cell count 4 days after stimulation (n = 4 donors per group; mean ± s.e.m.; **P < 0.01 and ***P < 0.001, two-sided paired Student’s t-test). h, RASA2 ablation rendered T cells resistant to Treg cell suppression compared with control T cells in an in vitro cancer cell-killing assay for one representative donor out of four (summary statistics shown in Extended Data Fig. 2g). Line is the mean and shaded area is 95% confidence interval for 3 technical replicates.

