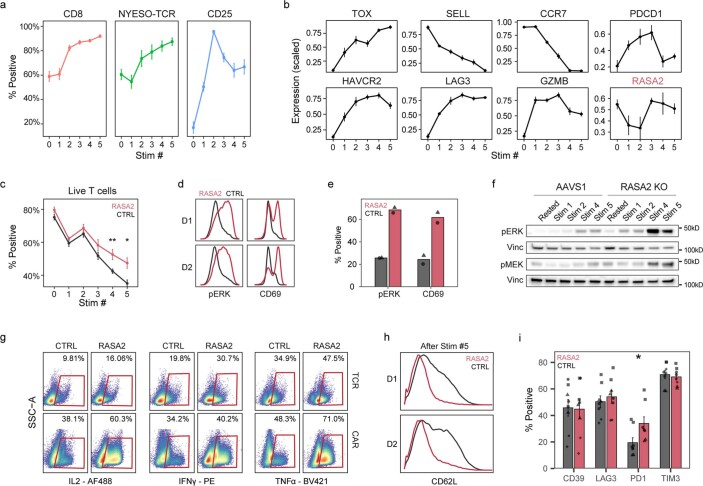
Extended Data Fig. 6. Repetitive tumor stimulation assay shows that RASA2 ablation rescues T cells from a dysfunctional state.
a, Metrics of NY-ESO-1-specific 1G4 TCR-T cells after each repetitive co-culture with A375 tumor cells, including percent positive for CD8, NY-ESO-1 1G4 TCR, and activation marker CD25 (assessed by flow cytometry, n = 4 T cell donors, lines are mean ± SEM). b, Gene expression levels for selected genes, including RASA2, with repeated tumor stimulation measured by RNAseq (n = 3 donors TCR-T cells and n = 3 donors CAR-T cells, mean ± SEM). c, T cell viability, measured by flow cytometry with Live/Dead stain, compared between RASA2 KO and control (CTRL) T cells (n = 4 donors, mean ± SEM, *p < 0.05 and **p < 0.01 for two-sided Wilcoxon test). d, RASA2 KO T cells following multiple stimulations show higher levels of phosphorylated ERK and CD69 compared to control cells (n = 2 donors). e, Fraction of T cells positive by flow cytometry for p-ERK and CD69 after 6 repeated co-cultures with A375 tumor cells (n = 2 donors, mean ± SEM, *p < 0.05 for two-sided Wilcoxon test). f, Western blot analysis for p-ERK and p-MEK levels in T cells after each repeated CD3/CD28 stimulation. g, Flow cytometry data for multiple effector cytokines (labeled on bottom) in NY-ESO-1-specific TCR-T cells (top row) and CD19-specific CAR-T cells (bottom row) after 6 repeated co-cultures with target tumor cells. h, Histograms showing CD62L levels in NY-ESO-1-specific T cells in 2 donors after 6 repeated co-cultures with A375 tumor cells. i, Percent of cells expression exhaustion-associated markers as measured by flow cytometry of T cells after multiple stimulations show similar levels between RASA2 KO and control-edited (CTRL) T cells (n = 4 donors, mean ± SEM, *p < 0.05 and ns is p > 0.05 for two-sided Wilcoxon test, shape denotes donor).

