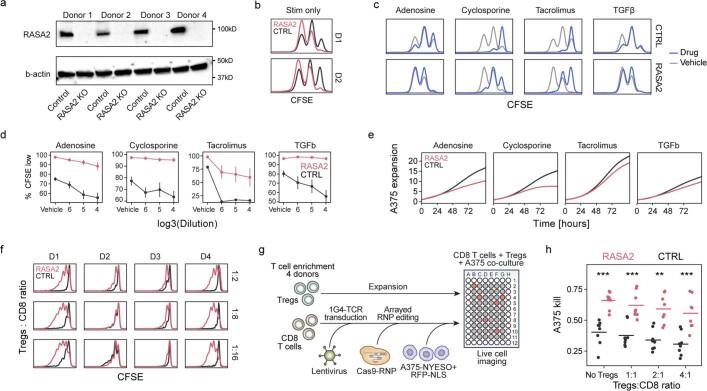
Extended Data Fig. 2. RASA2 validates as a T cell target to engineer resistance to suppressive conditions.
a, Western blots showing level of RASA2 ablation in T cells from 4 human blood donors. b, RASA2 KO T cells have a stimulation dependent proliferative advantage over control T cells, for two independent human donors (D1 and D2). c, CFSE staining traces showing how suppressive conditions inhibited T cell proliferation compared to vehicle conditions, for one representative human T cell donor. We note that although both RASA2-KO and control-edited (CTRL) T cells were inhibited by the suppressive signals to varying degrees, RASA2 KO T cells retain a consistent proliferation advantage in each condition. d, Summary of gated CFSE low (dividing) cells on y-axis across a range of suppressive conditions on x-axis (mean +/- SEM, n = 2 donors in 3 replicates). e, Cancer killing assay by NY-ESO-1-specific 1G4 TCR-T cells in the presence of suppressive molecules. Lines show the count of A375-RFP+ cancer cells as detected by live-cell microscopy, normalized by their count at t = 0. Grey area represents a 95% confidence interval of one representative donor with 3 technical replicates. f, Treg suppression assay. Stimulated CD8 T cells were stained by CFSE to track their proliferation in co-culture with suppressive Tregs. T cells from four distinct human donors are shown across the columns, with Tregs:CD8 ratio shown in the rows. g, Schematic of cancer killing assay by effector T cells in the presence of Tregs. h, Cancer cell killing (calculated by 1 - scaled AUC for the cancer cell growth curve) shown on the y-axis for a range of Tregs:CD8 ratios. Horizontal lines are the mean, dots are individual wells (CTRL = non-targeting guide, n = 4 human donors, each in 2 replicates, **p < 0.01 and ***p < 0.001 for two-sided Wilcoxon test).

