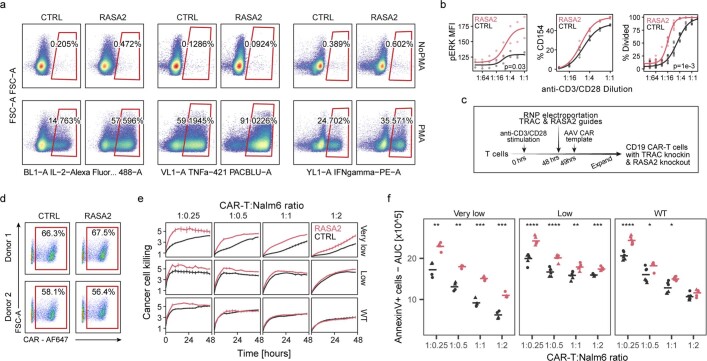
Extended Data Fig. 4. RASA2 ablation increases the sensitivity to antigen stimulation.
a, Flow cytometry plots showing gating for cytokines in control (CTRL) and RASA2 KO T cells with (bottom row) and without (top row) PMA stimulation. b, left: Phosphorylated ERK levels (y-axis) measured by flow cytometry 10 min after TCR stimulation with titrated concentrations of anti-CD3/CD28 complexes (1:1 is 25 µl/ml Immunocult, n = 2 T cell donors in duplicates, lines show the 4-parameter logistic fit); middle: Percentage of cells positive for the T cell activation marker CD154 measured 18 h after stimulation with titrated concentrations of anti-CD3/CD28 complexes (1:1 = 25 µl/ml Immunocult, n = 2 T cell donors in duplicate); right: percentage of cells that divided based on CFSE profiles 3 days after stimulation with anti-CD3/CD28 complexes (n = 2 T cell donors in triplicates, lines show the 4-parameter logistic fit, p-value from a two-sample Kolmogorov-Smirnov test). c, Schema of CD19 CAR-T cell production, where the CAR is knocked into the TRAC locus46 and RASA2 versus AAS1 is targeted with Cas9 RNPs. d, Flow cytometry plots of CD19-CAR positive T cells after the CAR knockin strategy described in (c). e, TRAC CAR-T cell killing of target Nalm6 cells engineered to express varying CD19 levels (rows) measured by annexin levels in live cell microscopy across increasing CAR-T:Nalm6 ratios (columns) over 48 h (one representative donor out of two, 3 technical replicates, error bars are mean ± SD). f, Summary of cancer cell killing (scaled AUC of annexin levels) shown on the y-axis for a range of effector T cells to target cell ratios. Horizontal lines are the mean (n = 2 human donors, each in triplicates, *p < 0.05, **p < 0.01, ***p < 0.001, ****p < 0.0001, for two-sided unpaired Student’s t-test, shape denotes donor).

