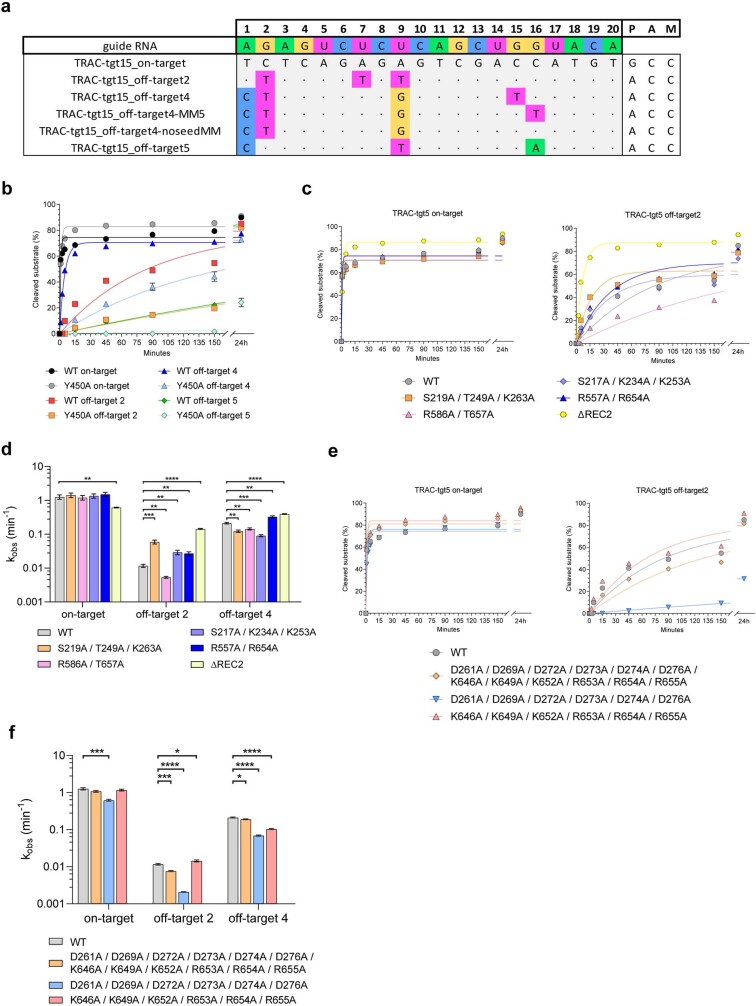
Extended Data Fig. 6. In vitro cleavage activities of structure-guided REC2 and REC3 mutants of Cas9.
a, Off-target sequences selected for nuclease activity assays. Nucleotide mismatches between the TRAC guide RNA and the target are highlighted; matching nucleotides are denoted by a dot. b, In vitro cleavage kinetics of Y450A mutants from which kobs values are derived using single exponential fitting. Data represents mean ± SEM (n = 4). c, In vitro cleavage kinetics of REC2/REC3 mutants from which kobs values are derived using single exponential fitting. Data represents mean ± SEM (n = 4). d, Cleavage rate constants of PAM-distal duplex stabilising REC2/REC3 mutants on on- and off-targets. Data represents mean fit ± SEM of n = 4 replicates, significance was determined by a two-tailed t-test. *, p < 0.05; **, p < 0.01; ***, p < 0.001; ****, p < 0.0001. e, In vitro cleavage kinetics of DDD and RRR helix mutants from which kobs values are derived using single exponential fitting. Data represents mean ± SEM (n = 4). f, Cleavage rate constants of Cas9 DDD and RRR helix mutants. Data represents mean fit ± SEM of n = 4 replicates, significance was determined by a two-tailed t-test. *, p < 0.05; **, p < 0.01; ***, p < 0.001; ****, p < 0.0001. On- and off-target substrates were fluorescently labelled on the PAM-proximal end of the target DNA strand in all panels.

