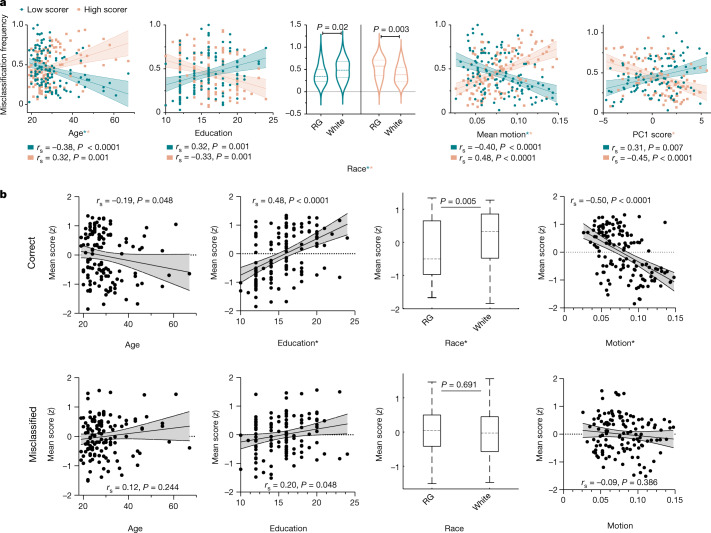
Fig. 4. Frequently misclassified participants defy stereotypical profiles.
a,b, Data are shown for all covariates that were found to have significant pairwise relationships with misclassification frequency by two-tailed rank correlation and Mann–Whitney U test. a, Relationship with misclassification frequency, averaged separately across measures on which participants scored high (‘high scorer’) and low (‘low scorer’). *Significant (P < 0.05) in corresponding full regression of low- or high-scorer misclassification frequency on these covariates. b, Relationship with mean scores, averaged separately across measures on which participants were frequently correctly (top) and incorrectly (bottom) classified. *Significant (P < 0.05) in full regression of mean (correct or misclassified) score on these covariates. Lines and shading: best-fit line from simple linear regression with 95% confidence bands. Violin plot lines represent median and quartiles. Box plot centre line and hinges represent median and quartiles, respectively; whiskers extend to most extreme non-outliers. All reported P values FDR adjusted (a, 30 tests; b: 8 tests). See Supplementary Tables 9 and 10 for relationships between misclassification frequency, mean score and all tested covariates, as well as sample sizes. RG, racialized groups.

