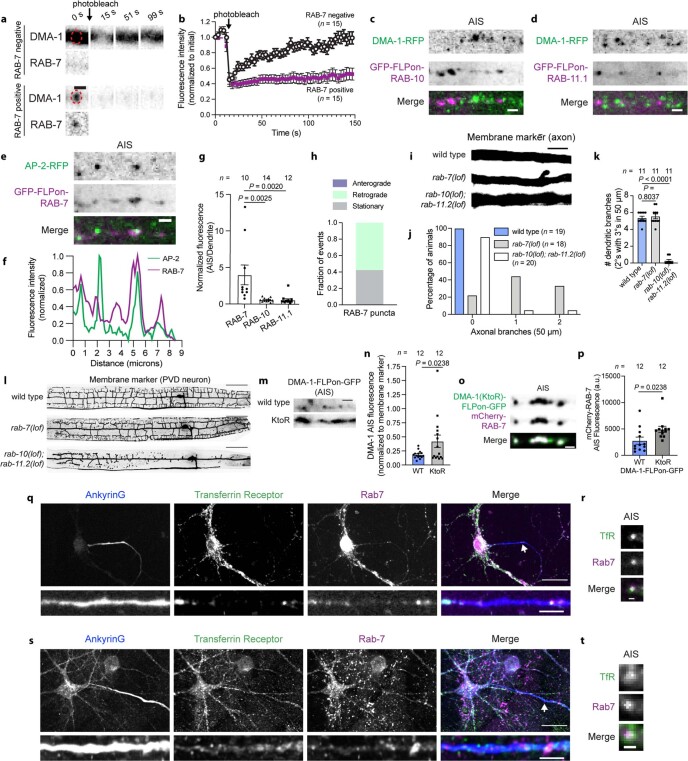
Extended Data Fig. 8. Dendritically polarized receptors are targeted to Rab7-positive late endosomes in the AIS.
(a) DMA-1-GFP FRAP dynamics. (b) Quantification of FRAP experiments described in a. Endogenously labelled DMA-1-RFP and (c) GFP-FLPon-RAB-10 or (d) GFP-FLPon-RAB-11.1 in the AIS. (e) AP-2-RFP and endogenous GFP-FLPon-RAB-7 puncta rarely colocalize in the AIS. (f) Linescan analysis of fluorescence intensity of images in e. (g) Endogenous RAB protein average fluorescence. (h) Endogenous GFP-FLPon-RAB-7 vesicle dynamics in the AIS (n = 19 vesicles from 15 animals). (i) PVD axon labeled with a myristoylated GFP membrane marker in the indicated animals. (j) Axonal branches in the 50 µm distal to the AIS in animals described in i. (k) Number of secondary dendritic branches with tertiary branches in the proximal 50 µm of the anterior dendrite. (l) PVD neuron labelled with a myristoylated GFP marker in the indicated animals. (m) AIS localization of cell-specific endogenous DMA-1-FLPon-GFP with lysine to arginine mutations in the cytoplasmic tail (KtoR: K536R, K583R, K595R). (n) Endogenous DMA-1 fluorescence of animals described in m. (o) Cell-specific endogenous DMA-1-FLPon-GFP (KtoR) colocalizes with mCherry-RAB-7 in the AIS. (p) Endogenous DMA-1-FLPon-GFP (KtoR) increases mCherry-RAB-7 fluorescence in the AIS. (q) Confocal images of cultured mouse neurons fixed and stained at DIV14 for the indicated endogenous proteins. Bottom shows AIS zoom, and brightness is increased to improve visibility. (r) Zoomed in region of a Rab7-labelled vesicle in the AIS from the image shown in q (arrow designates the cropped region). Brightness is increased for better visibility. (s) Confocal images of human neurons fixed and stained at DIV26 for the indicated endogenous proteins. Bottom shows AIS zoom. Brightness is increased for better visibility. Extra-neuronal Rab7 fluorescence is from co-cultured glia. (t) Rab7-labelled vesicle containing TfR in the AIS from the image in s (arrow designates the cropped region). Brightness is increased for better visibility. Data are shown as mean ± s.e.m. N-values are indicated on bar graphs and represent the number of animals or cells. P values in g and k were calculated using a one-way ANOVA with Šidák multiple comparison test. P values in n and p were calculated using a two-tailed unpaired t test. Scale bars, 50 µm (l), 20 µm (q top, s top), 5 µm (i, q bottom, s bottom), 1 µm (a, c, d, e, m, o, r, t).

