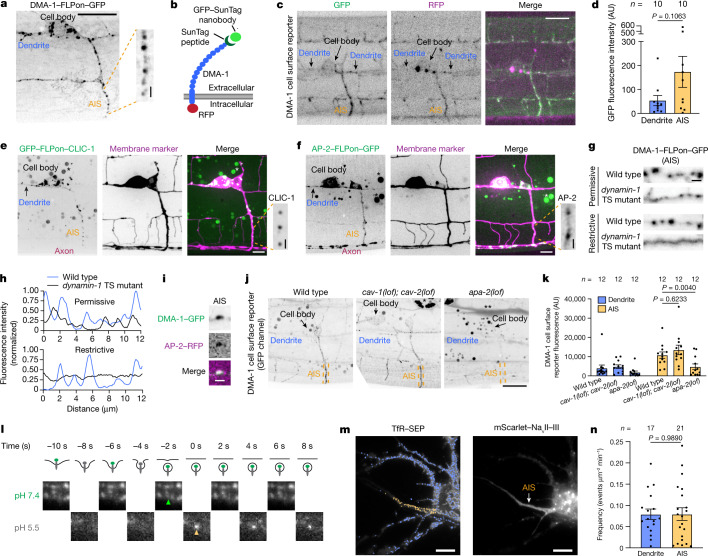
Fig. 2. Endocytosis of dendritically polarized receptors in the AIS.
a, Endogenous DMA-1–FLPon–GFP in the C. elegans PVD neuron AIS. Scale bar, 10 µm (main image), 1 µm (expanded selection). b, Schematic of the DMA-1 cell-surface reporter assay. DMA-1 is labelled with RFP and a 4× SunTag peptide. GFP-tagged SunTag nanobody is secreted from adjacent muscle cells. c,d, Confocal images (c) and DMA-1 cell-surface reporter fluorescence (d). Scale bar, 10 µm. e,f, Cell-specific endogenous expression of clathrin light chain (GFP–FLPon–CLIC-1) (e) and AP-2–FLPon–GFP (f). Asterisk indicates unrelated gut autofluorescence. Scale bar, 10 µm (main images), 1 µm (expanded selection). g, DMA-1–FLPon–GFP in the AIS of wild-type or dynamin-1 temperature-sensitive (TS) C. elegans animals. Scale bar, 1 µm. h, Line scan analysis of DMA-1 from images in g. i, Endogenous DMA-1–GFP is concentrated into AP-2-labelled structures in the AIS. Scale bar, 1 µm. j, GFP signal from the DMA-1 cell-surface reporter. Scale bar, 10 µm. k, GFP fluorescence of the DMA-1 cell-surface reporter in C. elegans animals. l, Top, illustration of endocytosis and the SEP signal during the pulsed-pH protocol (grey represents quenching). Endocytic vesicle scission generates an acid-resistant fluorescent punctum in the subsequent pH 5.5 step. Bottom, AIS of a cultured rat neuron (DIV9) imaged during the pulsed-pH protocol. An endocytic event (yellow arrow) is indicated by a pH 5.5-resistant signal that corresponds to a pre-existing cluster at pH 7.4 (green arrow). Contrast is increased for the pH 5.5 frames. m, A transfected rat neuron in culture (DIV9). Crosses represent endocytic events detected during a 10-min pulsed-pH protocol in the AIS (yellow, 85 events) and other neuronal regions (blue, 797 events). Scale bars, 10 µm. n, Frequencies of events in the indicated region. Data are mean ± s.e.m. n represents the number of animals or cells. k, Two-way ANOVA with Šidák's multiple comparison test. d,n, Two-tailed unpaired t-test.

