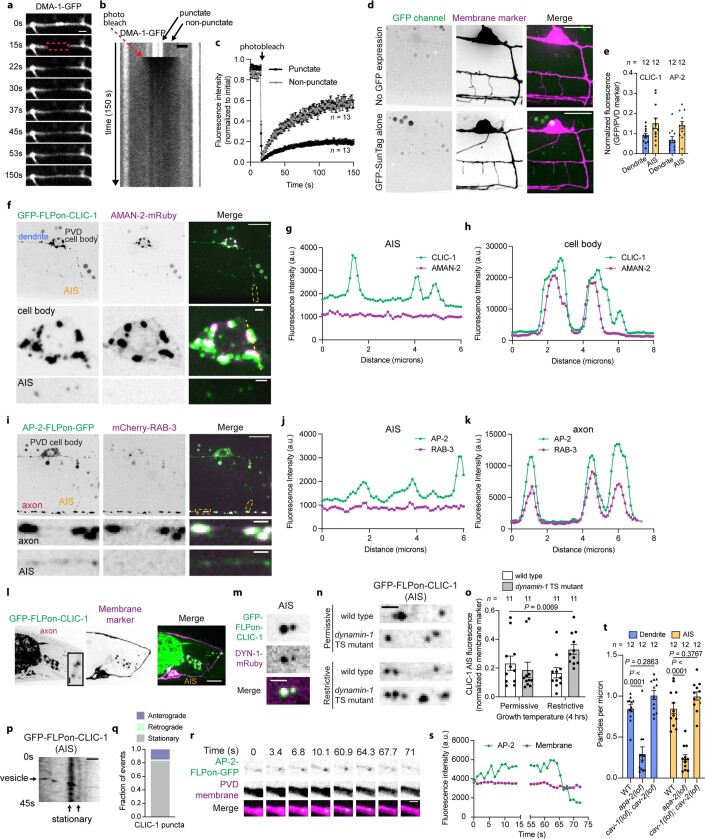
Extended Data Fig. 2. Characterization of endocytic vesicles in the AIS.
(a) FRAP of DMA-1-GFP pools in the PVD dendrite. (b) Kymograph analysis of FRAP experiment in a. (c) FRAP analysis of DMA-1-GFP pools (n = 13 animals/condition; P < 0.0001 using a two-way ANOVA). (d) Confocal images of DMA-1 cell surface assay controls in PVD. (e) Quantification of cell-specific endogenous proteins. (f) Cell specific expression of endogenous GFP-FLPon-CLIC-1 and Golgi-localized alpha mannosidase/AMAN-2[1-84aa]-mRuby in PVD. The Golgi network contains several Golgi-stacks66. Linescan analysis of fluorescence intensity in the (g) AIS and (h) cell body from the regions marked by yellow in f. (i) AP-2-FLPon-GFP and mCherry-RAB-3 expression in PVD. Linescan analysis of fluorescence intensity in the (j) AIS and (k) axon from the regions marked by yellow in i. (l) Cell-specific endogenous expression of GFP-FLPon-CLIC-1 in DA9. Inset shows AIS zoom. (m) Cell-specific endogenous GFP-FLPon-CLIC-1 and dynamin-1-mRuby colocalize in the AIS. (n) Cell-specific endogenous GFP-FLPon-CLIC-1 puncta in the AIS of the indicated animals. (o) Average fluorescence intensity of experiments described in n. (p) Kymograph of cell-specific endogenous GFP-FLPon-CLIC-1 in the PVD AIS. (q) GFP-FLPon-CLIC-1 puncta dynamics in the AIS (n = 40 vesicles). (r) Montage and (s) fluorescence intensity of AP-2-FLPon-GFP in the AIS. (t) GFP-positive puncta density from the DMA-1 cell surface reporter assay in the AIS of the indicated animals. Data are shown as mean ± s.e.m. N-values are indicated on bar graphs and represent the number of animals. P values were calculated as follows: o using a Brown-Forsythe and Welch one-way ANOVA, and t using two-way ANOVA with Tukey’s multiple comparisons test. Scale bars, 10 µm (d, f top, i top, l), 2 µm (a, b, m, n), 1 µm (f middle, f bottom, i middle, i bottom, l inset, p, r).

