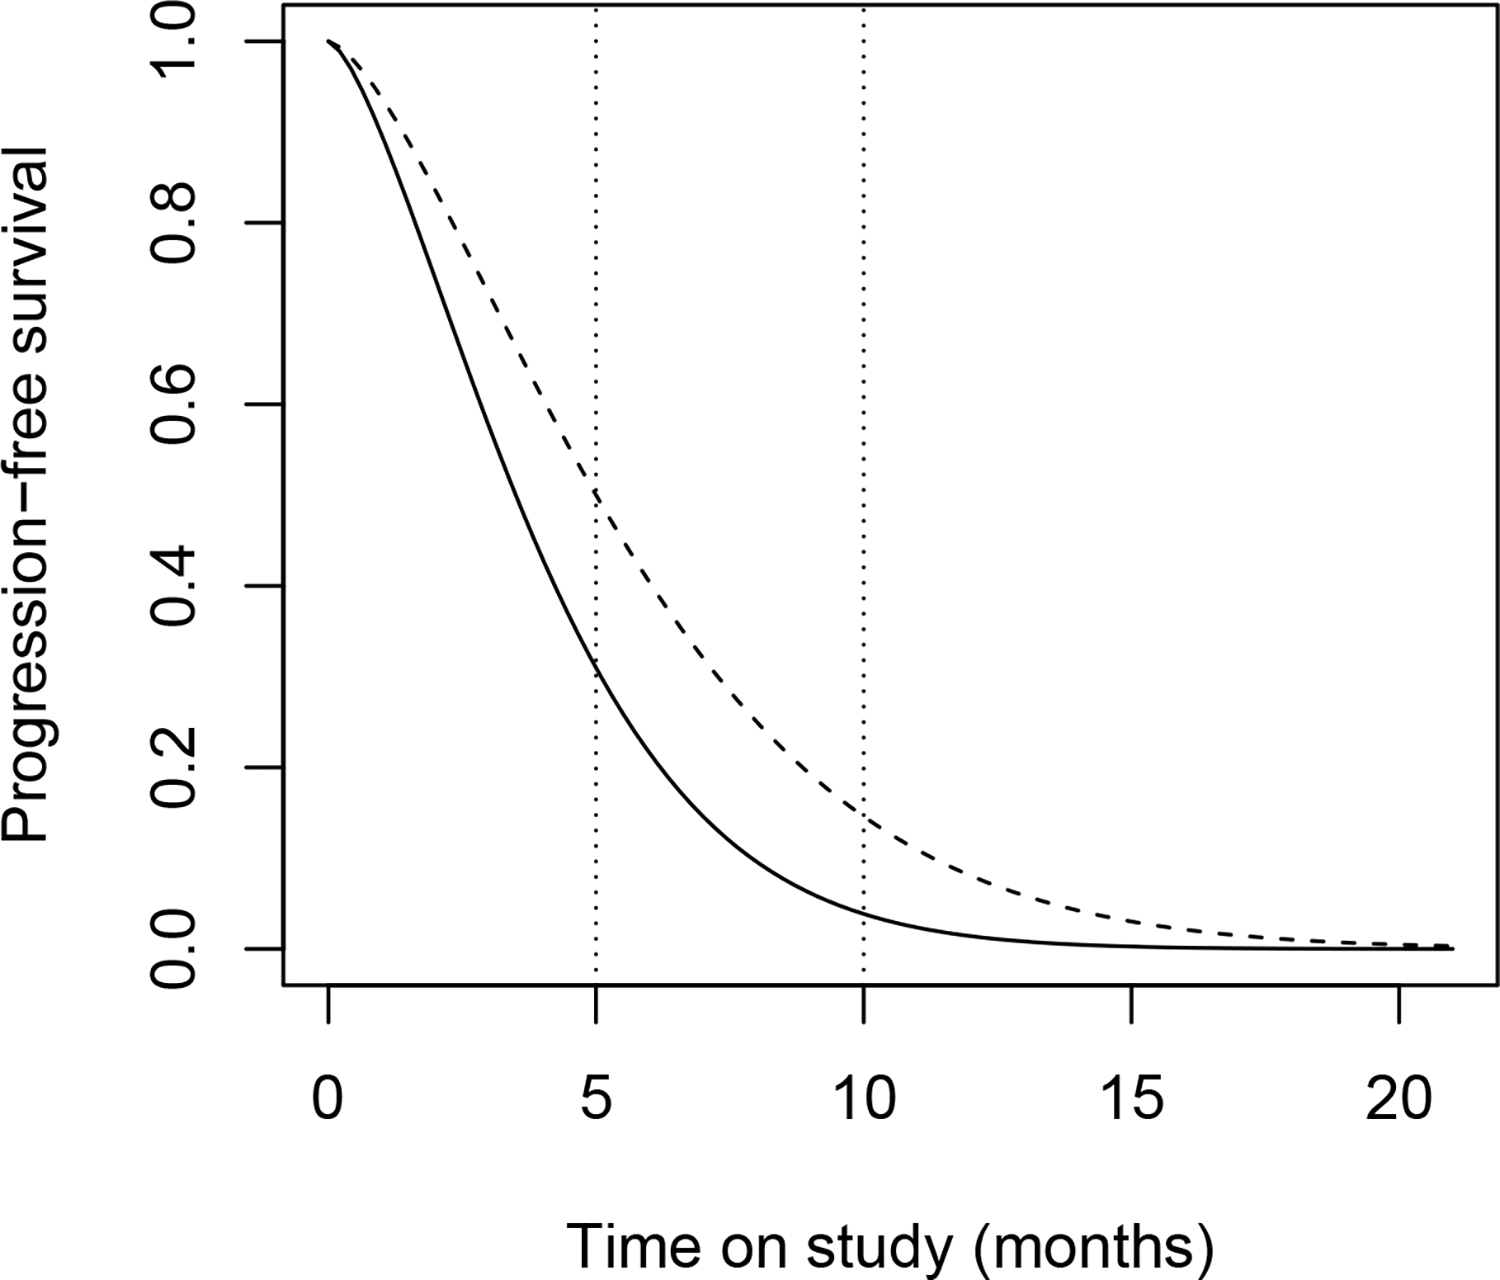
Figure 1:

The solid curve is the fitted Weibull distribution under the null hypothesis. The dash curve is the hypothetic survival distribution under the proportional hazard alternative. The two dot lines are the restricted follow-up for 5 and 10 months, respectively.
