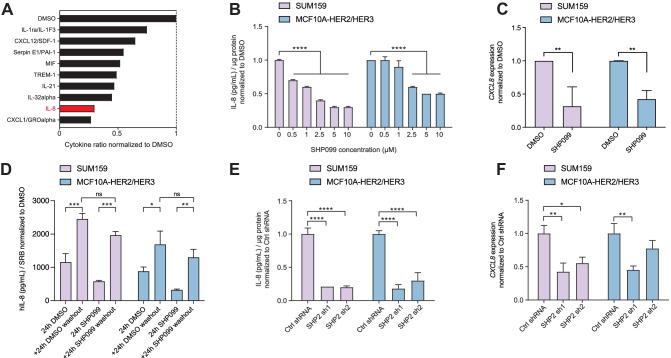
Fig. 1.
SHP2 blockade downregulates IL-8. (A) Bar graph representing the quantification of the nine most downregulated cytokines in SUM159 cell supernatants treated with SHP099 for 48 h relative to vehicle-treated cells. Data shown are dot quantification by pixel density from cytokine-array scans. (B) Bar graph representing IL-8 protein abundance in the supernatant of the indicated cell lines treated for 48 h at the SHP099 concentrations shown. Data are IL-8 protein concentrations normalized by total protein ± standard deviation (S.D.) (n = 3, ****P ≤ 0.0001, Two-way ANOVA test). (C) Bar graph representing CXCL8 mRNA expression in the indicated cell lines after 120 h of SHP099 inhibition (n = 3, **P ≤ 0.001, Two-way ANOVA test). (D) Bar graph representing IL-8 protein abundance in the supernatant of the indicated cell lines treated for 24 h with DMSO or 10 µM SHP099 normalized to the protein content of each well determined by SRB staining. Washout conditions were collected 24 h after media exchange. (n = 3, *P ≤ 0.05, **P ≤ 0.01, ***P ≤ 0.001, Two-way ANOVA test). (E) Bar graph representing IL-8 protein abundance in the supernatants of the indicated cell lines upon SHP2 knockdown. Data are shown ± S.D. (n = 3, ****P ≤ 0.0001, Two-way ANOVA test). (F) Bar graph representing CXCL8 mRNA expression in the indicated cell lines upon SHP2 knockdown. Data are shown ± S.D. (n = 3, *P ≤ 0.05, **P ≤ 0.01; Two-way ANOVA test)

