Fig. 2.
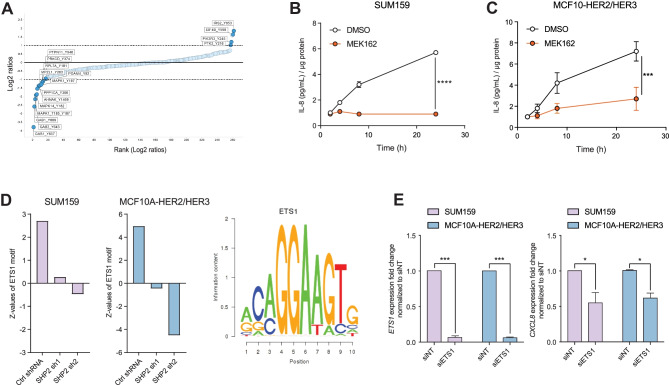
SHP2/MAPK enhances IL-8 levels via the transcription factor ETS1. (A) Scatter plot representing ranked phospho-tyrosine peptides depleted (left) or enriched (right) in SUM159 cells after 30 min of SHP099 treatment. Dark blue dots indicate phospho-peptides known to be involved in MAPK pathway regulation. The dotted line represents an arbitrary cutoff value. (B–C) Curves representing IL-8 protein abundance in the supernatants of the indicated cell lines upon MEK162 treatment at the indicated time points. Data shown are IL-8 protein concentrations normalized by total protein. Fold changed based on the 2h time point, ± S.D. (n = 3, ***P ≤ 0.001, ****P ≤ 0.0001, Two-way ANOVA test). (D) Bar graphs showing the ETS1 transcription factor activity profile (left) in SHP2 knockdown SUM159 tumors and MCF10A-HER2/HER3 3D cultures and its DNA-binding motif (right). (E) Bar graphs representing ETS1 and CXCL8 mRNA expression in the indicated cell lines 96 h after addition of siRNA (n = 3, *P ≤ 0.05, ***P ≤ 0.001, Two-way ANOVA test)

