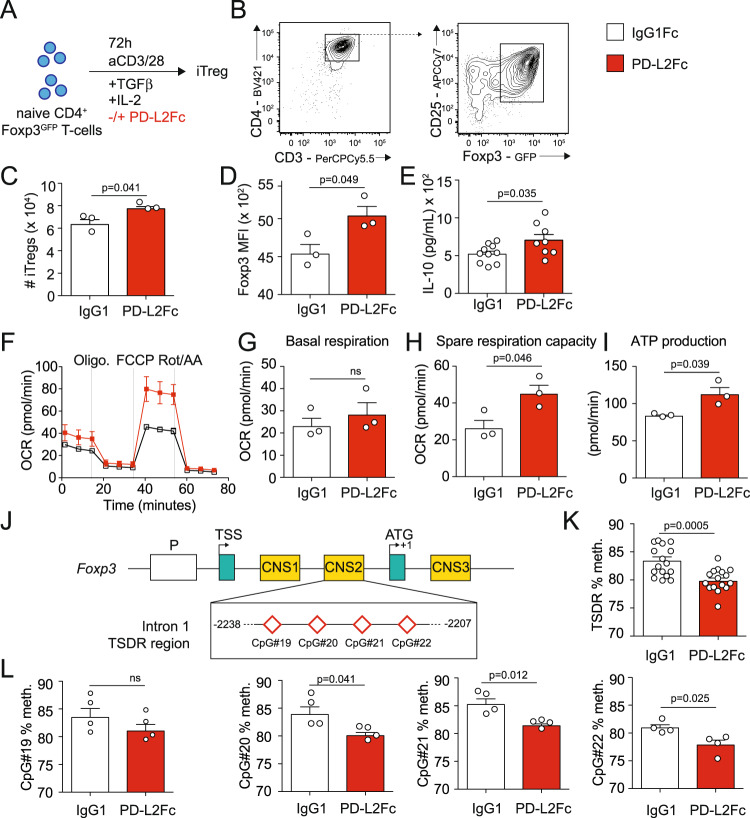
Fig. 2. PD-L2 regulates iTreg differentiation.
A Naive CD3+CD4+CD44−CD62L+Foxp3− naive T cells were isolated from the spleens of WT Foxp3GFP and cultured for 72 h in the presence of CD3/CD28 beads, IL-2 and TGF-β. Culture plates were coated with 5 µg/mL PD-L2Fc or control IgG1Fc for 30 min prior culture. B Representative flow cytometry plots of Foxp3 induction in CD3+CD4+CD24+Foxp3GFP+ iTregs after 72 h of culture. C Absolute numbers of iTregs after 72 h of culture, presented as mean ± SEM. n = 3 biologically independent samples. D Foxp3 mean fluorescence intensity (MFI) of iTregs after 72 h of culture, presented as mean ± SEM. n = 3 biologically independent samples. E IL-10 secretion by iTregs after 72 h of culture, presented as the mean ± SEM. n = 8 biologically independent samples. F Following culture, cells were transferred to PDL-coated HS mini plates and a Mito Stress test was performed to measure oxygen levels in the culture medium. Oxygen consumption rate (OCR) in response to Oligomycin (oligo.), FCCP and Rotenone (Rot/AA) sequential injections. n = 3 biologically independent samples. G Basal respiration in PD-L2Fc or control IgG1Fc groups. H Spare respiratory capacity in PD-L2Fc or control IgG1Fc groups. I ATP production in PD-L2Fc or control IgG1Fc groups. J Schematic of the Foxp3 promoter region, showing the intron 1 TSDR region containing CpG#19, CpG#20, CpG#21, and CpG#22 within the CNS2. K Average methylation of CpG#19, CpG#20, CpG#21, and CpG#22 in TSDR region. L Methylation of CpG#19, CpG#20, CpG#21, and CpG#22 in TSDR region. n = 4 biologically independent samples. Data are representative of 2 independent experiments and are presented as means ± SEM. Source data are provided as a Source Data file. A two-tailed Student’s t test for unpaired data was applied for comparisons between two groups.

