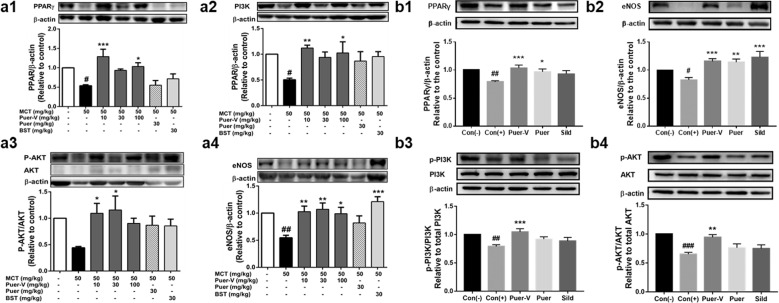
Fig. 10. Effects of Puer-V on the PPARγ/PI3K/Akt pathway in lung tissues of the rats with PAH and mice with HPH.
Densitometric analysis of the relative expression level of each protein compared to β-actin is shown in the lower panel, and representative pictures are shown in the upper panel: a1 PPARγ, a2 PI3K, a3 p-Akt/Akt, and a4 eNOS in lung tissues of the rats with PAH. b1 PPARγ, b2 eNOS, b3 p-PI3K/PI3K, and b4 p-Akt/Akt in lung tissues of mice with HPH. The results are presented as the mean ± SEM. #P < 0.05, ##P < 0.01 vs. the control group, *P < 0.05, **P < 0.01, ***P < 0.001 vs. the model group, n = 4.

