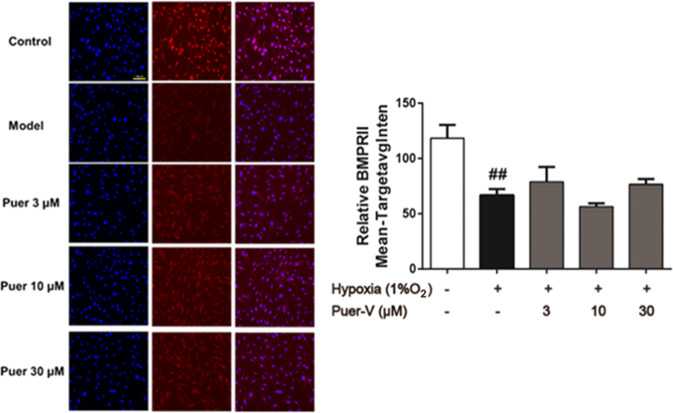
Fig. 14. Effects of Puer-V on BMPR2 expression in HPASMCs induced by hypoxia.
Representative images (magnified ×200) produced by the HCS system are shown in the left panel. Quantitative results of fluorescence intensity are shown in the right panel. Values are expressed as the mean ± SEM, n = 3. ##P < 0.01 vs. the control group. n = 3.

