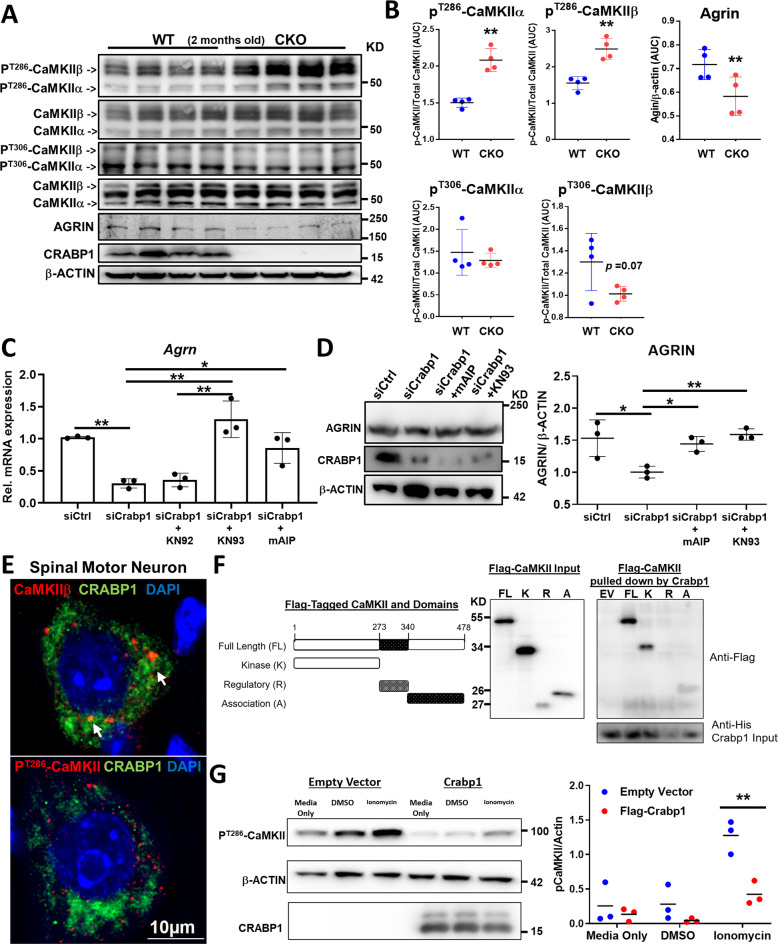
Fig. 6. CRABP1 directly targets CaMKII to suppress its activation, thereby up-regulating AGRIN expression.
A Western blots detecting phospho-T286-CaMKII, phospho-T306-CaMKII, total CaMKII (α & β isoforms), CRABP1, AGRIN and β-actin in spinal cord of 2 months old WT and CKO mice. B Quantification of phospho-CaMKII (α & β isoforms) and AGRIN levels shown on panel A. C qPCR analyses for total Agrn mRNA in Crabp1-silenced MN1s treated with various CaMKII inhibitors. D Western blot analysis and quantification of AGRIN protein in Crabp1 silencing experiments in MN1 cells treated with CaMKII inhibitors mAIP and KN93. E Immunostaining shows co-localization of endogenous CRABP1 and phospho-CaMKII (PT286-CaMKII) in WT spinal MNs. F In vitro pull down showing direct interaction between CRABP1 and CaMKII. Left: Diagram showing flag-tagged CaMKII full-length (FL), kinase (K), regulatory (R), and association (A) domains. Right: In vitro pulldown assay using purified His-CRABP1 to pulldown flag-tagged CaMKII and its domains. The left panel shows input control of Flag-CaMKII in the mixture, the right panel shows Flag-CaMKII fragments pulled down by His-CRABP1. Input of CRABP1 in the mixture is shown at the bottom panel. CRABP1 interaction with R domain is negligible G Left: Western blot shows that expressing CRABP1 dampens basal (lane 4 & 5 vs. 1 & 2) and ionomycin (10 μM; 10 min.)-stimulated (lane 3 vs. 6) CaMKII activity in reconstituted HEK293T system. β-actin shows the loading control. Right: Quantification of data shown on the western blots. Results are presented as means ± SEM, *p ≤ 0.05, **p ≤ 0.01, compared with WT or the control group. ##p ≤ 0.01, compared with the KN92 group.

