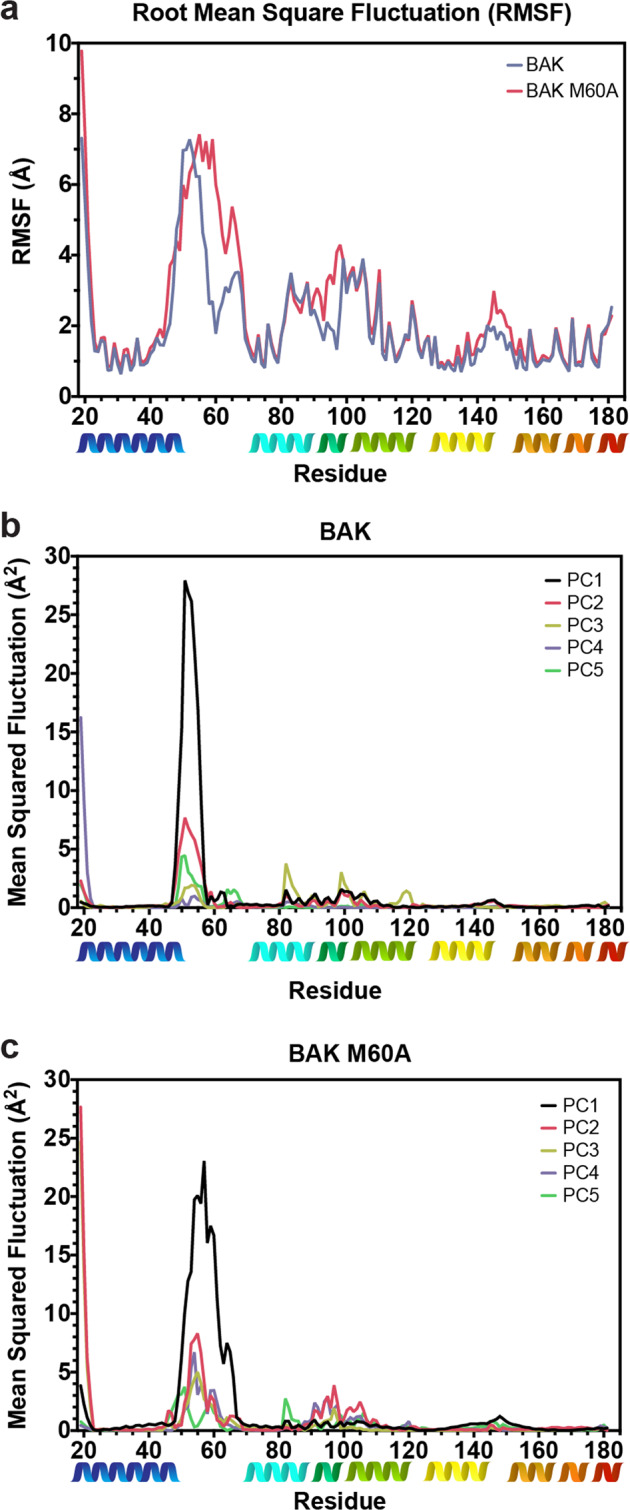
Fig. 4. Molecular dynamics.

a Root mean square fluctuations of BAK (blue) and BAK M60A (red) each determined from ten independent replicates run for 2 μs. b Principal component analysis of BAK molecular dynamics, showing the top five components. c Principal component analysis of BAK M60A molecular dynamics, showing the top five components.
