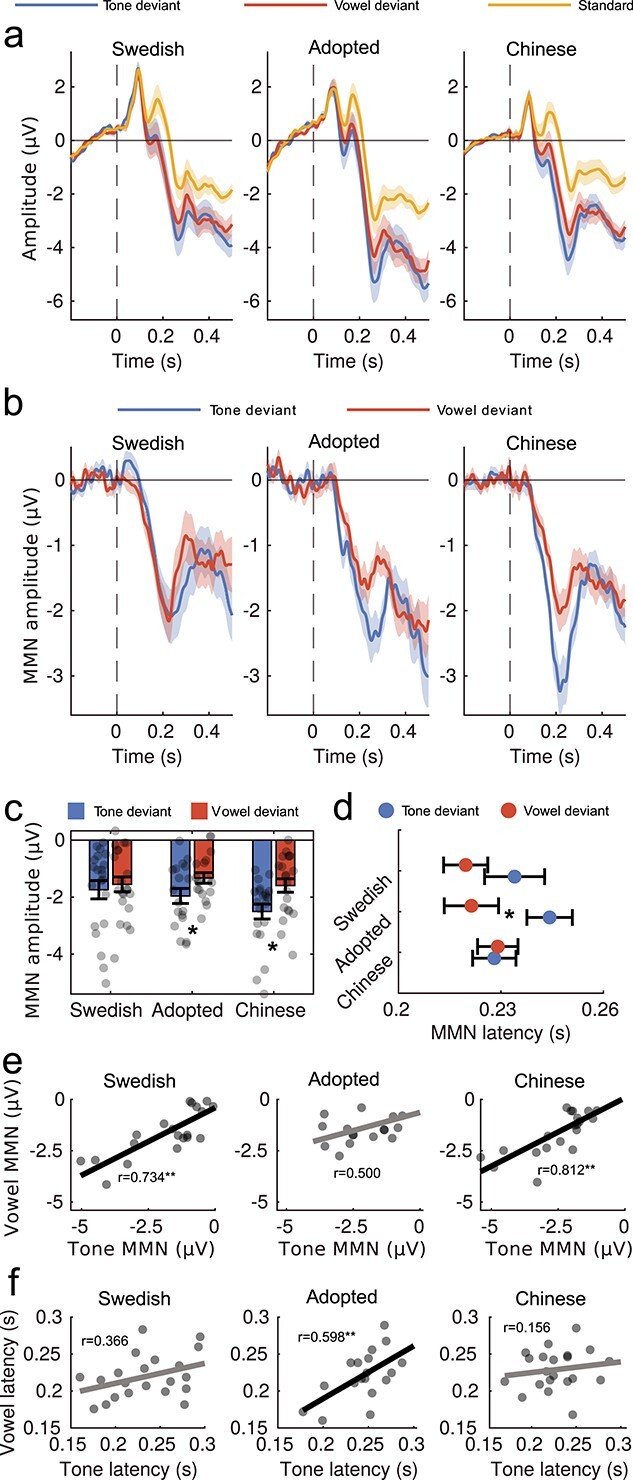
Figure 1.

MMN results. (a) Event-related brain potentials elicited by standards, tone, and vowel deviants in the three participant groups; (b) MMN modulation (deviant—standard) in each of the three participant groups; (c) bar plot of mean MMN amplitude measured between 0.15 and 0.3 s; jittered dots depict individual participant means; (d) MMN peak latency for all three groups in the two deviant conditions (tone, vowel), measured as the largest negative peak between 0.15–0.3 s; (e) regression plots of mean MMN amplitude modulation for the tone contrast against the vowel contrast and Pearson correlation scores; (f) regression plots of mean MMN peak latency (*P < 0.05, **P < 0.01). All measures are taken from representative electrode Fz. Error bars and shading depict s.e.m.
