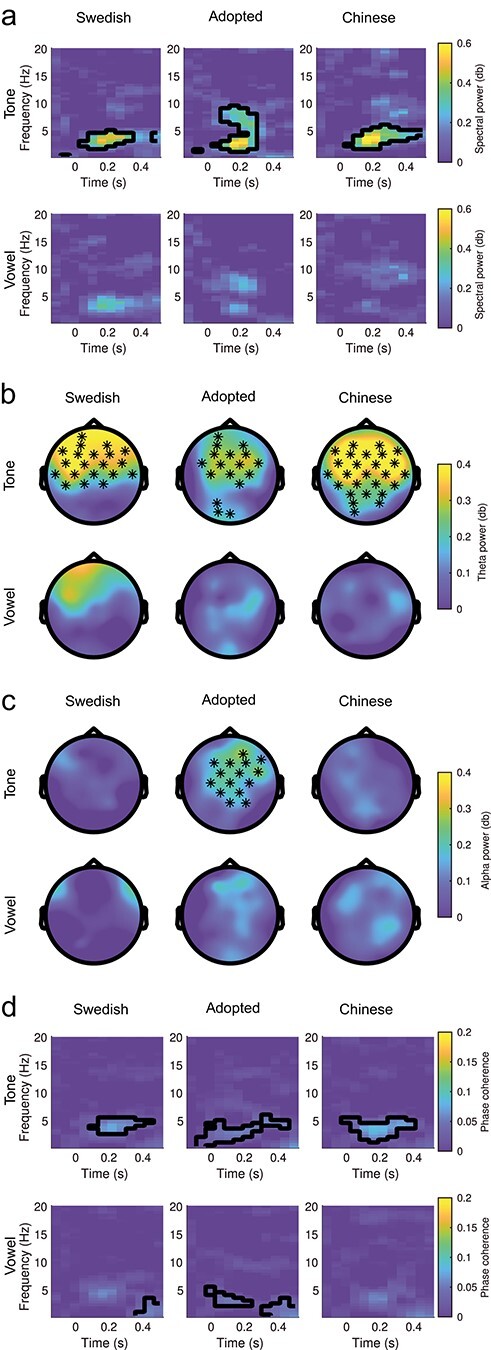
Figure 2.

MMN spectral power and phase coherence results. (a) Deviant minus standard power spectrum intensity over time at electrode Fz for tone (top) and vowel (bottom) deviants in the three experimental groups with significant clusters outlined. Differences were limited to the lower theta range in Chinese controls (tsum = 3293.72, SD = 0.002, CIrange = 0.004, P = 0.004) and Swedish controls (tsum = 2452.46, SD = 0.002, CIrange = 0.004, P = 0.005) but extended higher in the alpha range for tones for adoptees (tsum = 22.844, SD = 0.002, CIrange = 0.004, P = 0.004). (b) Spectral power topoplots (deviant minus standard) at Fz between 0.15 and 0.3 s after stimulus onset time in the theta (3–5 Hz) range. Electrodes showing significant differences detected by cluster-based permutation tests are indicated by a black dot (P < 0.05). (c) Topoplots in the alpha (7–9 Hz) range. Differences only occurred for the tone contrast in adoptees. (d) Phase coherence over time at electrode Fz with significant deviant versus standard differences outlined for adoptees (tsum = 2127.02, SD = 0.001, CIrange = 0.002, P = 0.001), Swedish controls (tsum = 365.352, SD = 0.002, CIrange = 0.005, P = 0.006), and Chinese controls (tsum = 2370.60, SD = 0.001, CIrange = 0.003, P = 0.002) in the tone condition, and in the vowel condition MMN time window for the adoptees (tsum = 623.16, SD = 0.005, CIrange = 0.009, P = 0.023) and for adoptees (tsum = 1042.42, SD = 0.003, CIrange = 0.006, P = 0.009) and Swedish natives (tsum = 789.61, SD = 0.006, CIrange = 0.012, P = 0.036) in the phonological categorization time window.
