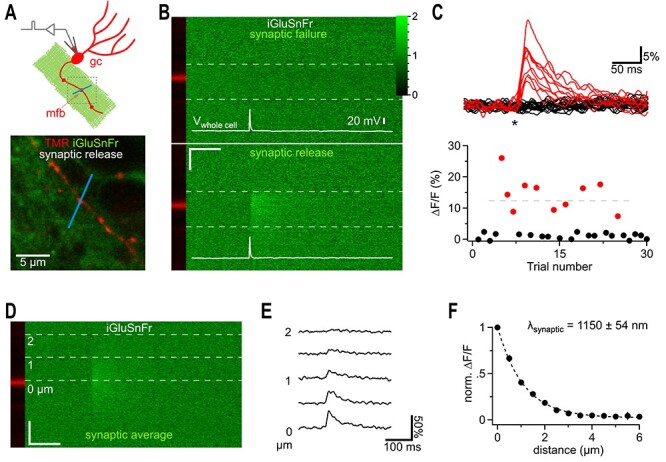
Figure 1.

iGluSnFr responses far away from synaptic release sites. (A) Cartoon illustrating the recording condition to quantify the spatial spread of synaptically released glutamate. A granule cell (gc) was patch clamped and dye-filled (red) to identify a synaptic bouton (mossy fiber bouton, mfb) surrounded by neuronal iGluSnFr expression (green). To visualize synaptic glutamate release, a 2P line scan was drawn through the bouton (blue line). The boxed region represents a typical frame scan (as illustrated in lower panel) obtained to identify boutons and adjust the line scan. Lower panel, example dual channel two photon frame scan of a dye-filled (TMR 400 μM, red, iGluSnFr, green) mfb used for stimulation and recording of synaptic glutamate release (as shown in I-L). The bath solution contained CNQX (10 μM) to eliminate network activity and 4-AP (100 μM) and DPCPX (1 μM) to elevate release probability and thereby shorten the required recording time (release probability normally below 10%). (B) Dual channel 2P line scan through the bouton shown in A). Top panel shows a failed glutamate release, while the, bottom panel depicts a successful glutamate release. White lines illustrate the corresponding whole cell current clamp recordings of the stimulated action potentials. The bouton is in the red channel displayed on the left and does not show changes in fluorescence (tracer dye). In each line scan image, the region between the two dashed gray lines was used to calculate the fluorescence over time traces shown in (C). Color scale expresses fluorescence with respect to baseline and also applies to (C) and (D). Note the rapidly rising signal only occurring at the position of the bouton and at the time of the action potential. Scale bar: 50 ms, 1 μm. (C) Top panel, 30 example traces of line scan fluorescence over time (as indicated in B) demonstrate the well-known typical fluctuation of responses (red) and failures (black) known from synaptic vesicle release. Asterisk, time of action potential. Fluorescence normalized to prestimulus levels. Bottom panel, peak amplitudes of the fluorescence traces for the 30 sequential stimulations obtained from this bouton. Red markers below the dashed horizontal line represent events putatively classified as single vesicle release responses. (D) Line scans of synaptic responses only (excluding release failures) were averaged per bouton to improve the signal-to-noise ratio for quantification of the spread of synaptically released glutamate. Gray dashed lines indicate distances from the center of release. (E) Fluorescence over time extracted from (D) at the indicated distances. Note that the decay is slowed with distance and that weak signals can still be detected at 2 μm. The peak of these signals was quantified and plotted in F. (F) Synaptically released glutamate activated iGluSnFr at distances of more than 1.5 μm (n = 6). In each experiment the peak amplitudes of fluorescent transients were normalized to the largest amplitude measured at the dye-filled bouton.
