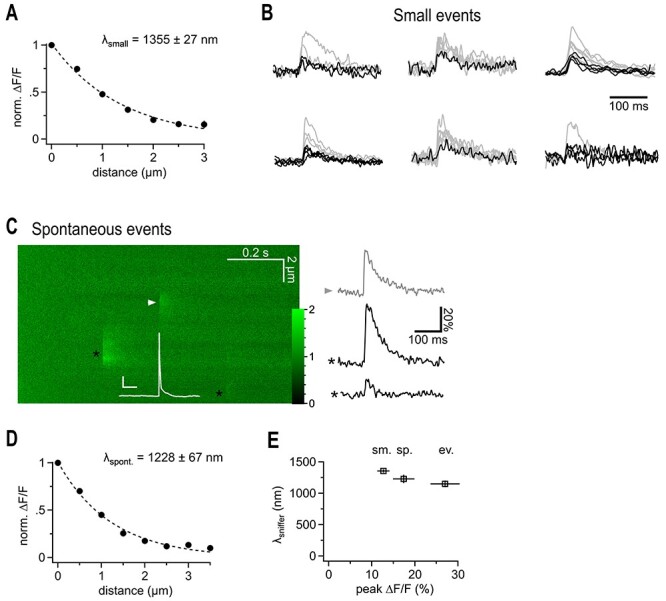
Figure 2.

Putative quantal iGluSnFr signals show a similarly extended spatial decay. (A) Spatial extent of small synaptic iGluSnFr transients. For each recording the smallest events were selected to exclude potential multiquantal events. Note that the lambda value is in the same range as the one derived from data obtained by averaging small and large transients (cf. Fig. 1). (B) iGluSnFr fluorescent traces, the selected fraction of traces used for (A) is shown in black. Traces of peak-scaled for comparison are not shown at the same vertical scaling. Events for the cell at the right top are shown in Figure 1. (C) Example 2P line scan across a dye filled bouton showing the action potential-elicited iGluSnFr response (arrowhead), and two spontaneous, off-bouton events (black asterisks) used for the analysis shown in D. The white trace represents the simultaneous current clamp recording of the cell stimulated to fire an action potential, which released transmitter at the arrow head position (scale bars: 20 mV, 50 ms, color scale expresses fluorescence with respect to baseline). Right panel illustrates fluorescent example traces calculated at the positions indicated by the symbols. (D) Spatial extent of spontaneous likely miniature glutamate transients. Analysis of events that occurred independently of the timing of the action potential induced in the patch-clamped granule cell. All of them must have been released from neighboring synapses because they did not occur at the dye-filled bouton. As spontaneous action potential firing of granule cells in slices is very rare and slices are also bathed in CNQX and APV, these events are likely due to miniature, action potential-independent, single vesicle glutamate release. (E) λsniffer only weakly depends on the magnitude of the signals and tends to be larger if more glutamate is released. From left to right: selected small, spontaneous, and evoked events.
