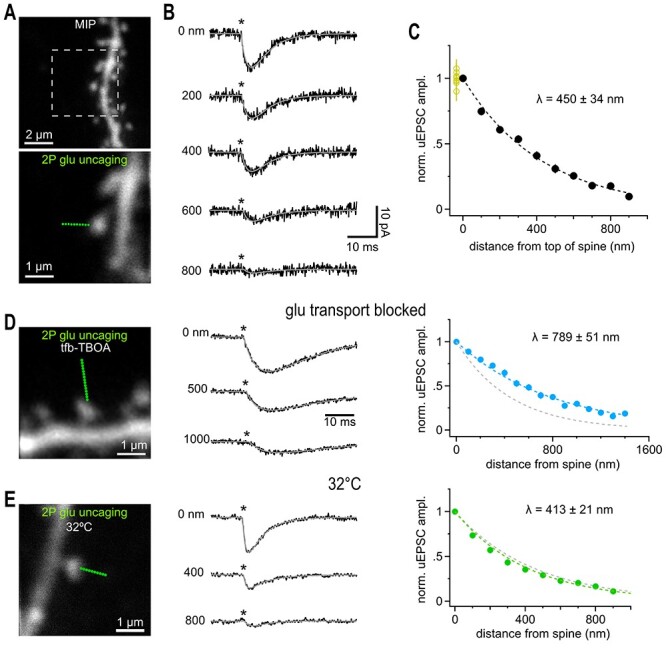
Figure 4.

Glutamate uncaging beyond the nearest synaptic neighbor distance activated also activates synaptic AMPA receptors. (A) Maximum intensity projection (MIP) of CA1 pyramidal cell dendrite dialyzed with 25 μM AlexaFluor 594 scanned with a two-photon microscope. Solitary spines were selected to avoid coactivation of neighboring structures. Lower image illustrates positioning of a sequence of glutamate uncaging points (green dots, step size 100 nm) to probe the spatial dependence of uEPSC amplitudes. Single image scanned at higher resolution. (B) Example current traces recorded in whole-cell voltage clamp mode showing the gradual decline of the response magnitude with distance. Light pulses (0.6 ms, asterisks) were applied at 1 Hz. Gray lines show fitted with a two-exponential function used to determine the peak amplitude. Note that even uEPSCs evoked at >400 nm peak within approximately 3–4 ms reflecting the rapid diffusional propagation of glutamate. Throughout the study we used the following conditions for isolating AMPA-Rs: 720 nm, 0.6 ms, 23 mW, 5 mM MNI-caged glutamate in presence of 1 μM TTX, 50 μM APV, 10 μM Gabazine. (C) Summary graph of the distance-dependent decay of the amplitude of uEPSCs (n = 27 spines), which could be well approximated by an exponential function with a length constant λ (dashed black line). Fitting of the individual amplitudes over distance revealed the indicated average value of λ. Applying 10 identical glutamate uncaging pulses at 1 Hz at the spine head yielded stable responses (yellow circles at 0 nm, n = 8) indicating that desensitization or run-down of receptors is negligible. (D) Left: 2P-photon scan of a spine incubated in 1 μM tfb-TBOA, 100 μM APV, 40 μM MK801, 10 μM gabazine, and 1 μM TTX. Uncaging responses were probed over an extended distance by additional uncaging spots (green dots, step size 100 nm). Middle: Example uEPSCs (averages) taken from the three distances indicated. Note the prominent residual current at 1000 nm (compare to B). Asterisk, time of uncaging pulse; gray line, uEPSC fit. Right: Extended action range of uncaged glutamate in the presence of tfb-TBOA. Blue markers represent the average decay of uEPSCs measured from 21 spines yielding an average λ as indicated. Dashed gray line shows the control λ (450 nm) as determined in C. (E) as in (A–C) but slices were kept at 32 °C. Compared to results obtained at room temperature the action range of uncaged glutamate at AMPA-Rs is only slightly shortened at 32 °C suggesting that transmembraneous transport of glutamate (highly temperature dependent) is too slow to modify extracellular glutamate signaling on this short spatial scale. Around 32 spines yielded the average λ as indicated. Gray dashed line shows the control λ (450 nm) at room temperature (cf C).
