
Figure 5.
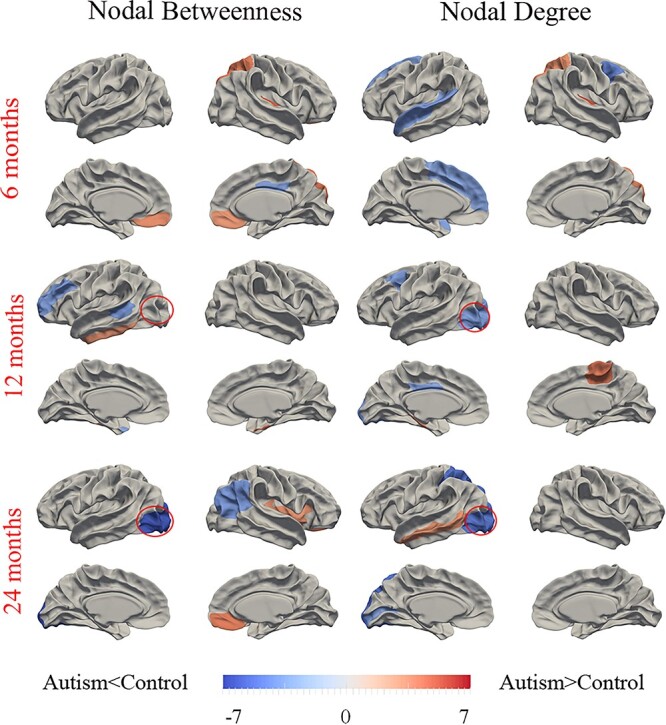
Differences between autism and control participants in regional SCN topological metrics (betweenness and degree) at the three time points of 6, 12, and 24 months of age. Regions that showed significant differences of AUC at the range from 14% to 40% network sparsity in regional betweenness and degree between autism and controls were colored. The color bar represents log(1/P), where P is the statistical differences between the two groups. Hot/cold colors denote regions that have significantly higher/lower nodal betweenness or degree in autism than in controls, respectively. The red circles indicate the left lateral occipital cortex with changed P-values in nodal betweenness or degree between the two groups from 6 to 24 months ofage.