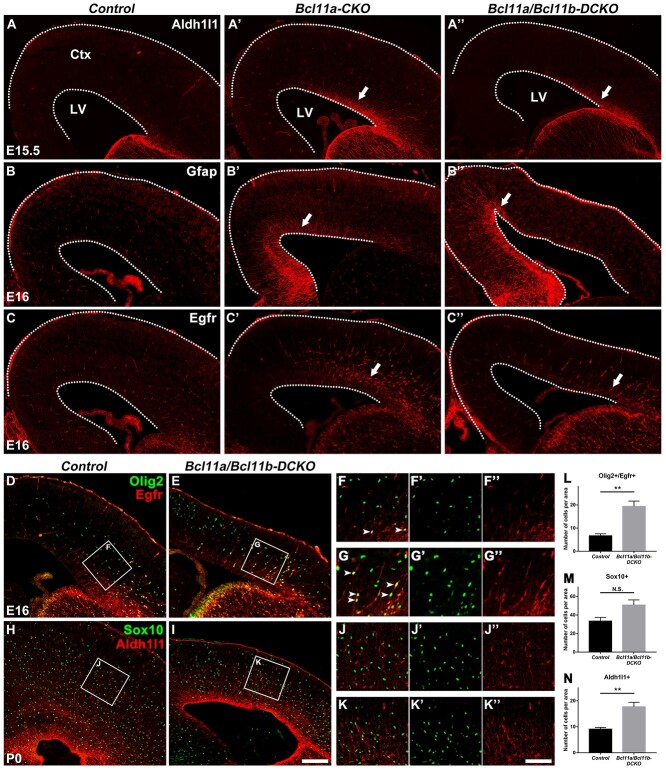
Figure 10.
Bcl11a and Bcl11b regulate the cortical RGC lineage progression. (A–A′′) The expression of astrocytic marker Aldh1l1 is markedly higher in Bcl11a-CKO and Bcl11a/b-DCKO than in control mice (arrows) at E15.5. (B–B″) The glial marker Gfap shows precocious expression in the cortices of Bcl11a-CKO and Bcl11a/b-DCKO mice (arrows) at E16. (C–C″) Glial progenitor marker Egfr shows significantly increased expression in progenitors of Bcl11a-CKO and Bcl11a/b-DCKO cortices (arrows) at E16. (D–G′) Olig2+/Egfr+ glial progenitors are increased in the Bcl11a/b-DCKO cortices compared to the control mice at E16 (arrows). (H–K′) Sox10+ oligodendrocytes, Aldh1l1+ astrocytes in the CP are increased in the cortices of Bcl11a/b-DCKO mice at P0. (L–N) Quantification of Olig2+/Egfr+, Sox10+, and Aldh1l1+ cells at E16 or P0. (Student’s t-test, N.S., not significant, **P < 0.01, n = 3, mean ± SEM) Ctx, cortex; LV, lateral ventricle. White dashed lines indicate the LV and cortex boundaries. Scale bars: 200 μm in I for A–C″, D–E, and H–I, 100 μm in K″ for F–G′′ and J–K″.

