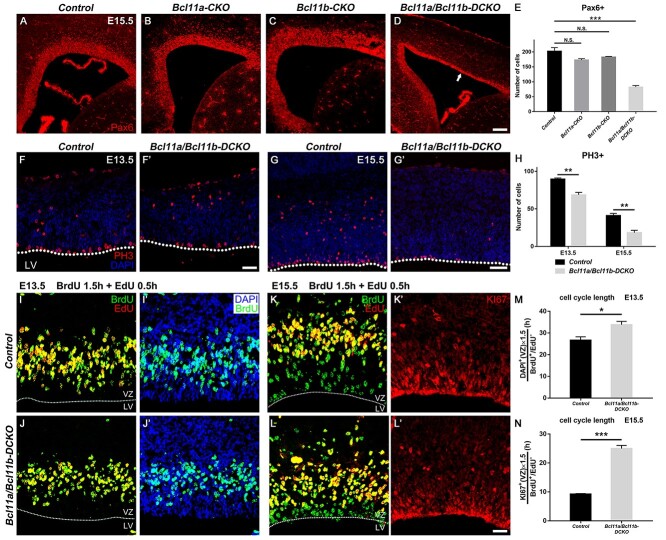
Figure 3.
Depletion of cortical RGCs in Bcl11a/b-DCKO. (A–D) Pax6 expression in VZ in control (A), Bcl11a-CKO (B), Bcl11b-CKO (C), and Bcl11a/b-DCKO mice (D, arrow) at E15.5. (E) The numbers of Pax6+ cells in the cortical VZ of Bcl11a/b-DCKO are significantly fewer than those in the controls at E15.5 (one-way ANOVA, followed by a Tukey HSD post hoc test; N.S., not significant, ***P < 0.001, n = 3, mean ± SEM). (F–G′) Representative images of PH3+ cells in the VZ/SVZ of controls and Bcl11a/b-DCKO at E13.5 (F and F′) and E15.5 (G and G′), respectively. (H) The numbers of PH3+ cells in the cortical VZ are significantly fewer in the Bcl11a/b-DCKO mice than those in the control mice (Student’s t-test, **P < 0.01, n = 3, mean ± SEM). (I–L′) Representative images of BrdU, EdU, and DAPI stainings in the controls and Bcl11a/b-DCKO at E13.5 (I–J′) and BrdU, EdU, and KI67 stainings in the controls and Bcl11a/b-DCKO at E15.5 (K–L′). (M) Quantification of cell cycle length index DAPI+(VZ)/BrdU+ EdU− in the progenitors as indicated in (I–J′) (Student’s t-test, *P < 0.05, n = 3, mean ± SEM). (N) Quantification of cell cycle length index KI67+(VZ)/BrdU+ EdU− in the progenitors as indicated in (K–L′) (Student’s t-test, ***P < 0.001, n = 3, mean ± SEM) LV, lateral ventricle; VZ, ventricular zone. White dashed lines indicate the LV boundaries. Scale bars: 200 μm in D for A–D; 100 μm in F′ for F–F′; 160 μm in G′ for G–G′; 30 μm in L′ for I–L′.

