Figure 5.
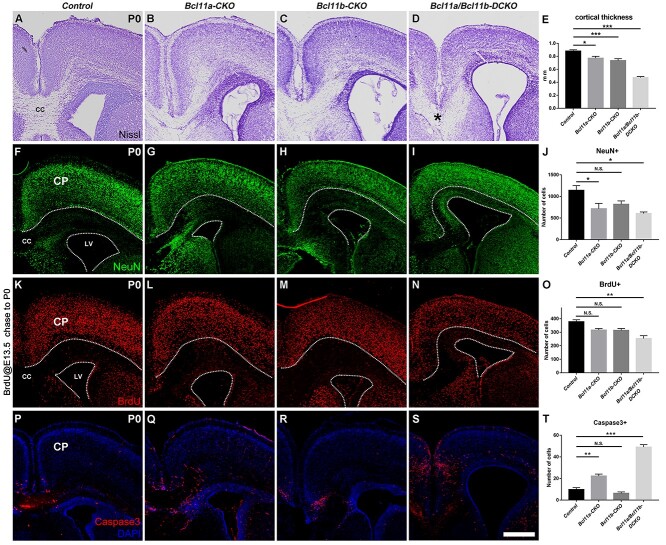
Defects of cortical structure, production, differentiation, and cell death in the cortices of Bcl11a/b-DCKO mice. (A–D) Nissl staining of cortices in the control mice (A) and conditional knockout mice (B–D). Note the disorganization of laminar structure and loss of corpus callosum in Bcl11a/b-DCKO (asterisk in D). (E) Measurement of the cortical thickness at P0. (one-way ANOVA, followed by a Tukey HSD post hoc test; *P < 0.05, ***P < 0.001, n = 6, mean ± SEM). (F–I) Immunostaining of pan-neuronal marker NeuN at P0. (J) Quantification of NeuN+ neurons in the cortical plate at P0 (one-way ANOVA, followed by a Tukey HSD post hoc test; N.S., not significant, *P < 0.05, n = 3, mean ± SEM). (K–N) BrdU is administered at E13.5; BrdU+ cells in the cortices are analyzed at P0. (O) Quantification of the BrdU+ neurons in the cortical plates at P0 (one-way ANOVA, followed by a Tukey HSD post hoc test; N.S., not significant, **P < 0.01, n = 3, mean ± SEM). (P–S) Immunostaining of cell death marker Cleaved Caspase-3 (red) at P0. (T) Numbers of Caspase-3+ cells are significantly higher in the Bcl11a/b-DCKO than in the controls (one-way ANOVA, followed by a Tukey HSD post hoc test; N.S., not significant, **P < 0.01, ***P < 0.001, n = 3, mean ± SEM). CP, cortical plate; CC, corpus callosum; LV, lateral ventricle. White dashed lines indicate the CP and LV boundaries. Scale bars: 400 μm in S for A–D, F–I, K–N, and P–S.

