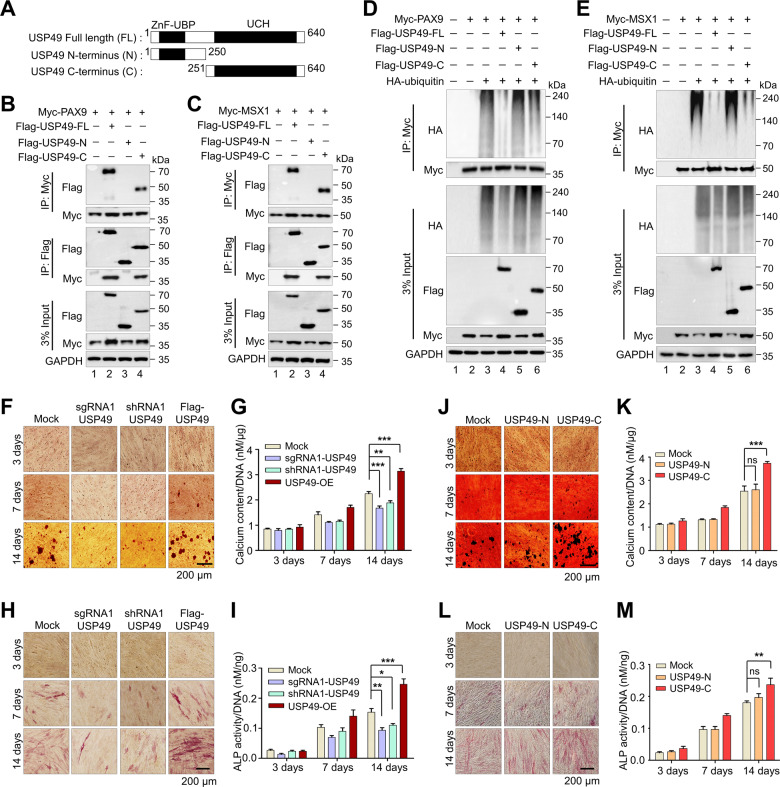
Fig. 5. Odontogenic differentiation is regulated by USP49.
A Schematic representation of full length USP49 (1-640 aa) encoding ZnF-UBP and UCH domains (represented as USP49-FL), N-terminus USP49 (1-250 aa) encoding ZnF-UBP domain (represented as USP49-N), and C-terminus USP49 (251-640 aa) encoding UCH domain (represented as USP49-C). B Interactions between USP49-FL and PAX9; USP49-N and PAX9; USP49-C and PAX9 by IP and immunoblotting with the indicated antibodies. The presented immunoblots are representative of three independent experiments (n = 3). C Interaction between USP49-FL and MSX1; USP49-N and MSX1; USP49-C and MSX1 by IP followed by immunoblotting with the indicated antibodies. The presented immunoblots are representative of three independent experiments (n = 3). D The deubiquitination of PAX9 was analyzed by transfecting HEK293 cells with USP49-FL, USP49-N, and USP49-C, and determined by IP followed by immunoblotting with the indicated antibodies. The presented immunoblots are representative of three independent experiments (n = 3). E The deubiquitination of MSX1 was analyzed by transfecting HEK293 cells with USP49-FL, USP49-N, and USP49-C, and determined by IP followed by immunoblotting with the indicated antibodies. The presented immunoblots are representative of three independent experiments (n = 3). F Representative images of alizarin red staining performed in hDPSCs (Mock, Flag-USP49, sgRNA1 targeting USP49 and shRNA1 targeting USP49) group at the indicated time points (days 3, 7, and 14). Scale bar: 200 µm. The presented microscopic images are representative of three independent experiments (n = 3). G To quantify the alizarin red staining, the calcium content was quantified using the CPC method and normalized to the DNA content per well as measured on days 3, 7, and 14. The calcium content was calculated based on the mean of three technical replicates for each individual experiment. The data presented here represent the mean ± standard deviation (SD) of three independent experiments (n = 3) (**P < 0.001 and ***P < 0.0001) by analysis of variance (ANOVA) followed by Tukey’s post hoc test. (H) Representative images of hDPSCs (Mock, Flag-USP49, sgRNA1 targeting USP49 and shRNA1 targeting USP49) group stained with alkaline phosphatase (ALP) at the time points indicated (days 3, 7, and 14). Scale bar: 200 µm. The presented microscopic images are representative of three independent experiments (n = 3). I ALP activity was quantified and normalized to the DNA content obtained from each individual dataset on days 3, 7 and 14. The ALP activity was calculated based on the mean of three technical replicates for each individual experiment. The data presented here are the mean ± SD of three independent experiments (n = 3) (*P < 0.05, **P < 0.001 and ***P < 0.0001), by ANOVA followed by Tukey’s post hoc test. J Representative images from ALZ staining in hDPSCs (Mock, USP49-N, USP49-C) on days 3, 7, and 14. Scale bar: 200 µm. The presented microscopic images are representative of three independent experiments (n = 3). K To quantify the ALZ staining, the calcium content was quantified using the CPC method and normalized to the DNA content per well as measured on days 3, 7, and 14. The calcium content was calculated based on the mean of three technical replicates for each individual experiment. The data presented here represent the mean ± SD of three independent experiments (n = 3) (ns = non-significant, **P < 0.001) by ANOVA followed by Tukey’s post hoc test. L Representative images of hDPSCs (Mock, USP49-N, USP49-C) group stained with ALP on days 3, 7, and 14. Scale bar: 200 µm. The presented microscopic images are representative of three independent experiments (n = 3). M ALP activity was quantified and normalized to the DNA content obtained from each individual dataset on days 3, 7 and 14. The ALP activity was calculated based on the mean of three technical replicates for each individual experiment. The data presented here represent the mean ± SD of three independent experiments (n = 3) (ns = non-significant, **P < 0.001) by ANOVA followed by Tukey’s post hoc test.

