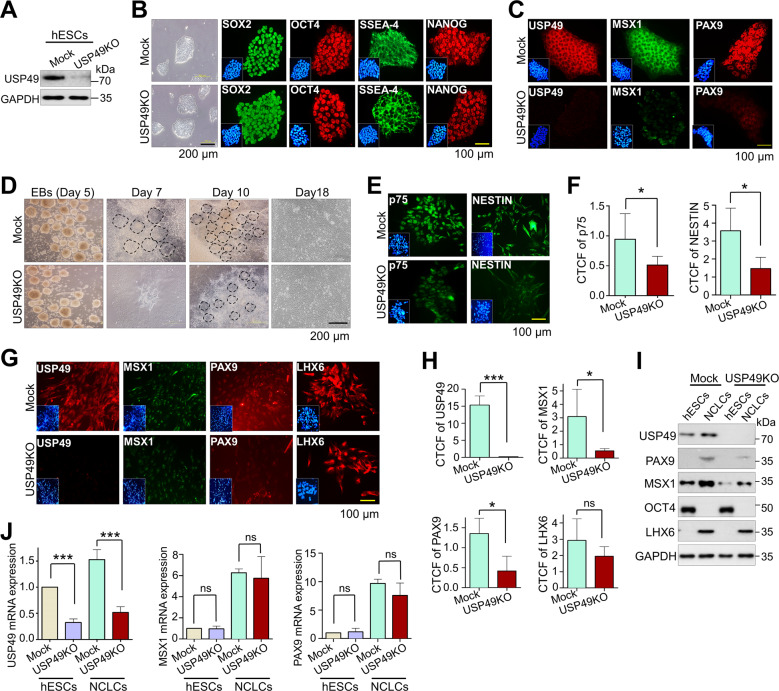
Fig. 6. Loss of USP49 in hESCs delays differentiation by downregulating PAX9 and MSX1.
A USP49 KO in hESCs was confirmed by analyzing endogenous USP49 protein expression through Western blotting. GAPDH was used as the internal loading control. The presented immunoblots are representative of three independent experiments (n = 3). B Expression levels of endogenous pluripotency markers (SOX2, OCT4, SSEA-4 and NANOG) were confirmed by immunofluorescence staining in mock and USP49 KO-hESCs. Scale bar: 100 µm. The presented microscopic images are representative of three independent experiments (n = 3). C Endogenous expression levels of USP49, MSX1 and PAX9 were confirmed by immunofluorescence staining in mock and USP49 KO-hESCs. Scale bar: 100 µm. The presented microscopic images are representative of three independent experiments (n = 3). D Embryoid bodies (EBs) derived from mock and USP49 KO-hESCs were differentiated into NCLCs. Cell morphology during differentiation was analyzed by bright field microscopy at the indicated time points. Dotted outline indicates neural rosette formation during differentiation. Scale bar: 200 µm. The presented microscopic images are representative of three independent experiments (n = 3). E Immunofluorescence staining was performed on mock and USP49 KO-derived NCLCs on day 18 to analyze the NCLC markers (p75 and NESTIN). Scale bar: 100 µm. The presented microscopic images are representative of three independent experiments (n = 3). F Corrected total cell fluorescence (CTCF) intensity of p75 and NESTIN in mock and USP49 KO-derived NCLCs was quantified by the ImageJ software. CTCF intensities were calculated for each individual experiment based on the mean of three technical replicates The data presented here represent the mean ± SD of three independent experiments (n = 3), (*P < 0.05) by Student’s t test. G Effects of USP49 gene disruption on the endogenous expression levels of dental mesenchymal markers (MSX1, PAX9, and LHX6) were analyzed by immunofluorescence staining on day 18 of NCLC differentiation. Scale bar: 100 µm. The presented microscopic images are representative of three independent experiments (n = 3). H Corrected total cell fluorescence (CTCF) intensity of USP49, MSX1, PAX9, and LHX6 in mock and USP49 KO-derived NCLCs was quantified by the ImageJ software. CTCF intensities were calculated for each individual experiment based on the mean of three technical replicates. The data presented here represent the mean ± SD of three independent experiments (n = 3), (*P < 0.05, ***P < 0.0001 and non-significant (ns), by Student’s t test). I Effects of USP49 KO on the endogenous expression levels of dental mesenchymal markers (MSX1, PAX9, and LHX6) and a pluripotency marker (OCT4) in undifferentiated and differentiated cells were analyzed by immunoblotting with specific antibodies. GAPDH was used as the internal loading control. The presented immunoblots are representative of two independent experiments (n = 2). J Effects of USP49 KO on the mRNA expression levels of USP49, MSX1, and PAX9 in undifferentiated and differentiated cell lines were analyzed by qRT-PCR with specific primers. Relative mRNA expression levels are shown after normalization to GAPDH mRNA expression. The fold changes of mRNA levels were calculated for each individual experiment based on the mean of three technical replicates. The data presented here represent the mean ± SD of three independent experiments (n = 3). For USP49 mRNA expression: ***P < 0.0001 for mock-hESCs vs. USP49 KO-hESCs, ***P < 0.0001 for mock-NCLCs vs. USP49 KO-NCLCs. For MSX1 mRNA expression: non-significant (ns) for mock-hESCs vs. USP49 KO-hESCs, non-significant (ns) for mock-NCLCs vs. USP49 KO-NCLCs. For PAX9 mRNA expression: non-significant (ns) for mock-hESCs vs. USP49 KO-hESCs, non-significant (ns) for mock-NCLCs vs. USP49 KO-NCLCs. Statistical significance was analyzed by ANOVA followed by Tukey’s post hoc test.

