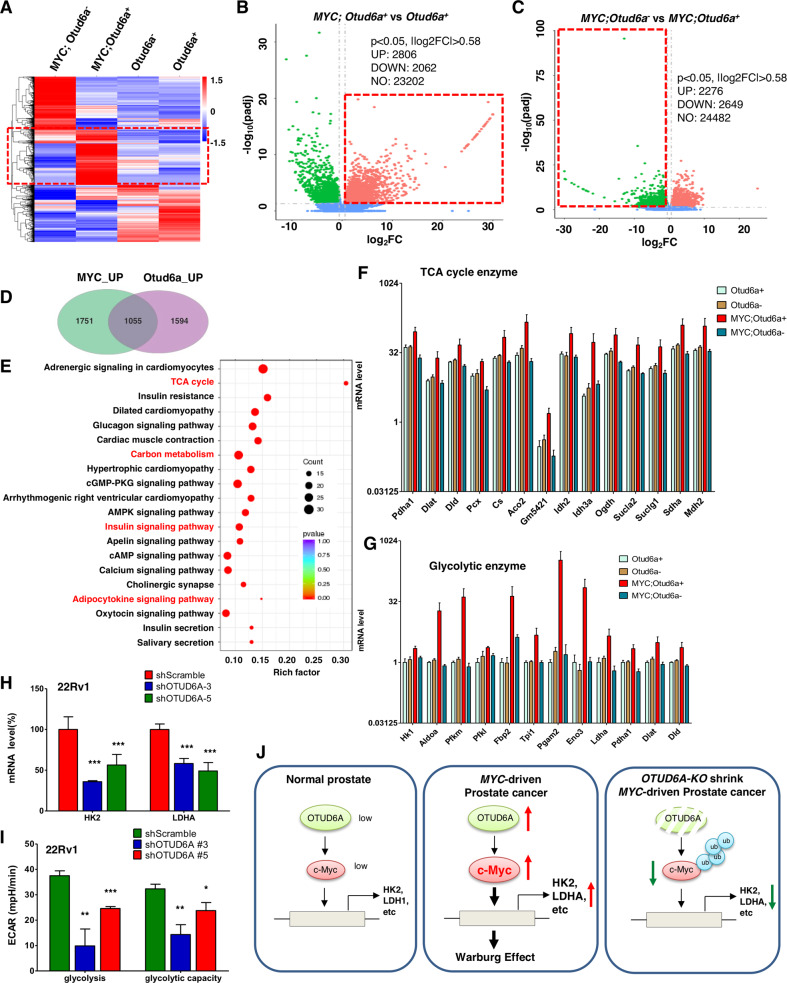
Fig. 7. The OTUD6A/c-Myc axis remodels prostate cancer metabolism.
A Heatmap showed the differentially expressed genes (DEG) in prostate tissue and prostate tumors derived from Otud6a+/y (N = 5), Otud6a−/y (N = 5), Hi-Myc;Otud6a+/y (N = 4) and Hi-Myc;Otud6a−/y mice (N = 5). B Volcano plot showed the DEG between Otud6a+/y (N = 5) vs. Hi-Myc;Otud6a+/y mice (N = 4). p < 0.05, |log2FC | > 0.58. C Volcano plot showed the DEG between Hi-Myc;Otud6a−/y (N = 5) vs. Hi-Myc;Otud6a+/y mice (N = 4). p < 0.05, |log2FC | > 0.58. D Venn diagram showed the genes that were co-regulated by c-Myc and Otud6a in prostate tumors. E Functional enrichment KEGG assay for the genes that were co-regulated by c-Myc and Otud6a. F The mRNA expression of genes in tricarboxylic acid (TCA) cycle from prostate tissue and prostate tumors. G The mRNA expression of genes in glycolysis from prostate tissue and prostate tumors. H Depletion of OTUD6A led to reduced mRNA expressions of HK2 and LDHA in 22Rv1 cells. Cells were depleted of OTUD6A by shRNA, and the mRNA levels were measured by qPCR. ***p < 0.001. I Depletion of OTUD6A reduced the glycolysis level in 22Rv1 cells. Cells were depleted of OTUD6A by shRNA, and the cancer cell metabolism was measured by XF24 Seahorse extracellular flux analyzer. *p < 0.05, **p < 0.01, ***p < 0.001. J A schematic diagram shows that c-Myc induces metabolic remodeling and prostate tumorigenesis, which could be antagonized by depletion of Otud6a.

