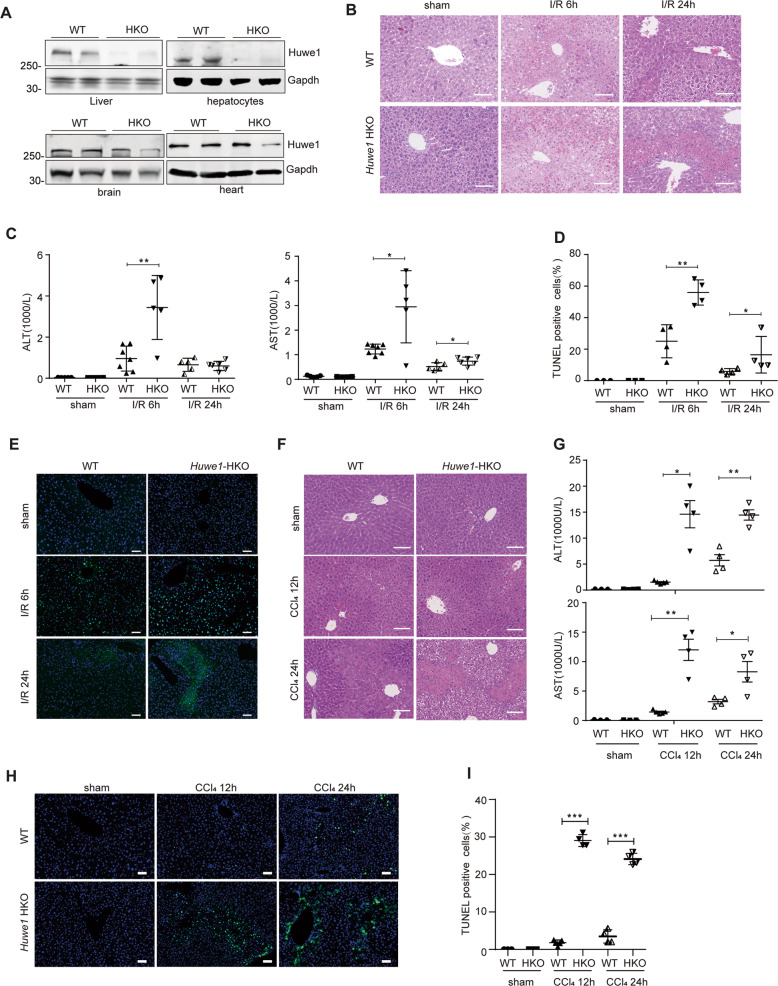
Fig. 2. Loss of Huwe1 in hepatocytes exacerbates acute liver injury in mice.
A Huwe1 protein levels in major organ samples from WT and hepatocyte-specific Huwe1 HKO mice. n = 2. Gapdh served as the loading control. B The representative H&E staining of liver sections from WT and Huwe1 HKO mice in the sham and I/R groups at 6 h and 24 h post-reperfusion. Scale bar, 100 μm. n = 5–7 for each time point. C Serum ALT (left) and AST (right) levels in WT and Huwe1 HKO mice at 6 h and 24 h after I/R injury. D–E The statistical quantification of TUNEL-positive cells (D) and the representative images of TUNEL staining (E, scale bar = 50 μm) in liver sections of Huwe1 WT and LKO mice 6 or 24 h after I/R. F–I WT and Huwe1 HKO mice were intraperitoneally injected with 5% CCl4 at 300 μl/kg body weight for 12 and 24 h. F The representative H&E staining of liver sections from WT and Huwe1 HKO mice in the sham and CCl4 groups post CCl4 injection for 12 or 24 h. Scale bar, 100 μm. n = 5–6 for each time point. G Serum ALT (up) and AST (bottom) levels in WT and Huwe1 HKO mice at 12 or 24 h after CCl4 injection. H, I Representative images of TUNEL staining (H) and the statistical quantification of TUNEL-positive cells (I). Scale bar = 50 μm. *p < 0.05, **p < 0.01 compared with sham group by unpaired two-tailed Student’s t-test.

