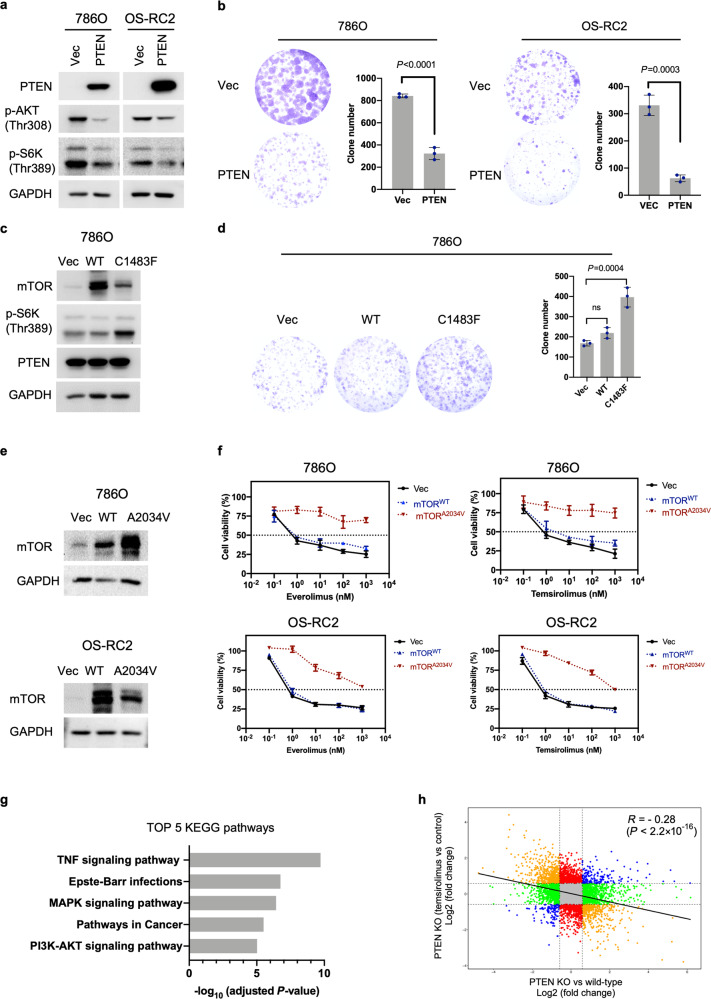
Fig. 4. PTEN affects cell proliferation and rapalog sensitivity through the mTOR pathway.
a 786O and OS-RC2 cells were stably transduced with empty vector (pQCXIH-vec) or PTEN (pQCXIH-PTEN) retroviruses. PTEN, p-AKT (Thr308) and p-S6K (Thr389) protein levels were determined by immunoblot analysis. b Images and corresponding quantification of colony formation by 786O and OS-RC2 cells stably expressing vec or PTEN. The data are presented as the mean ± SD (n = 3) of one representative experiment out of three. Significance was assessed using Student’s t test. c 786O cells were stably transduced with empty vector (pLVX-vec), wt (pLVX-mTORwt) or mutant (pLVX-mTORC1483F) lentiviruses. The established stable cells were next infected with retroviruses encoding PTEN (pQCXIH-PTEN). The immunoblots show the expression of the indicated proteins. d Images and corresponding quantification of colony formation by the stable cells generated in (c). The data are presented as the mean ± SD (n = 3) of one representative experiment out of three. Significance was assessed using ANOVA followed by Tukey’s test. e 786O and OS-RC2 cells were stably transduced with empty vector (pLVX-vec), wt (pLVX-mTORwt) or mutant (pLVX mTORA2034V) lentiviruses. The immunoblots show the expression of mTOR. f Viability assay of the stable cells generated in (e) after treatment with everolimus or temsirolimus at the indicated concentrations for 6 days. The data are presented as the mean ± SD (n = 3) of one representative experiment out of three. g KEGG pathway enrichment analysis of the DEGs identified between PTEN KO#2 and parental HEK293A cells. The bars indicate the enrichment scores, −log10 (adjusted P values). h Comparison of the transcriptional changes induced by PTEN loss versus temsirolimus treatment (1000 nM, 24 h). The blue dots represent genes that were either upregulated or downregulated in both comparisons; the orange dots represent genes that were significantly upregulated in one comparison and downregulated in the other comparison. The green dots represent genes significantly changed only upon PTEN deletion in HEK293A cells, while the red dots represent genes significantly changed upon temsirolimus treatment in HEK293A PTEN KO#2 cells. The R value was calculated for the correlation; Pearson’s correlation coefficient.

