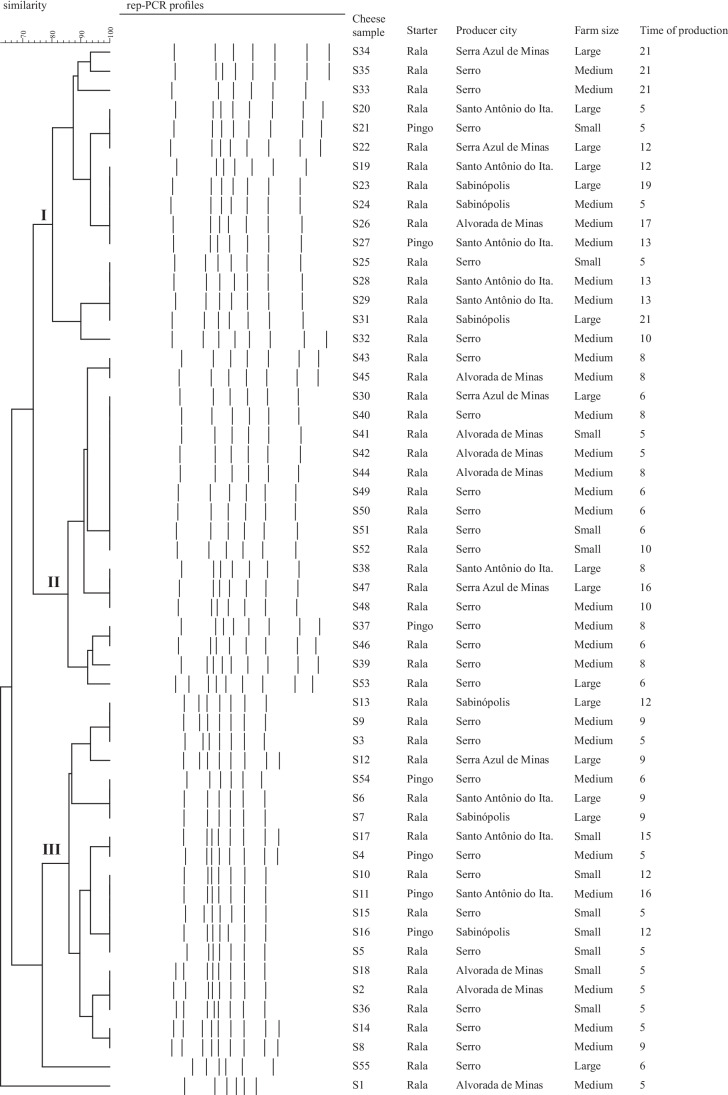
Fig. 1.
Cluster analysis of rep-PCR fingerprints obtained from Serro Minas artisanal cheese samples with different production characteristics (city; farm size—based on daily milk production—small, lower than 150 L; medium, 150–200 L; large, higher than 200 L; starter culture; and time of production, days). The similarities between the profiles were calculated by using Dice coefficient, and the dendrogram were constructed using unweighted pair group method with arithmetic mean (UPGMA), with tolerance of 1.5% and optimization of 5%

