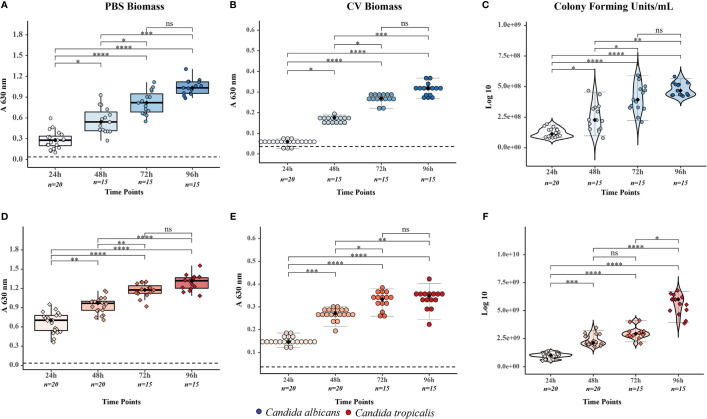
Figure 1.
Evaluation of the biofilms formed by Candida albicans and Candida tropicalis during the specified time window (24, 48, 72, and 96 h) through the biomass and viability assays. Biofilm biomass was evaluated through two methodologies of optical density measurement, while viable cells within the biofilm were analyzed through colony-forming unit counting to describe the number of viable microorganisms. All these results were grouped and plotted for each species, where color dots represent the individual result of each assay (blue dots for (C) albicans and red dots for (C) tropicalis), overlaid box plots cover the upper and lower interquartile ranges, whiskers extend to extreme datapoints, and the black diamond represents the median (data shown in Table 1 ). (A) Biomass of (C) albicans biofilm by phosphate-buffered saline (PBS) suspension method, (B) biomass of (C) albicans biofilm by crystal violet (CV) staining method, (C) viability of (C) albicans biofilm by colony-forming unit counting, (D) biomass of (C) tropicalis biofilm by PBS suspension method, (E) biomass of (C) tropicalis biofilm by CV staining method, and (F) viability of (C) tropicalis biofilm by colony-forming unit counting. The illustrated statistical analysis between time in biomass and viability assays for each Candida species was realized through post-hoc Dunn’s test using a Benjamini–Hochberg adjustment (all data are shown in Supplementary Material Information S1 ), more specifically *p < 0.05; **p < 0.01; ***p < 0.001; ****p < 0.0001; ns, non significant.

