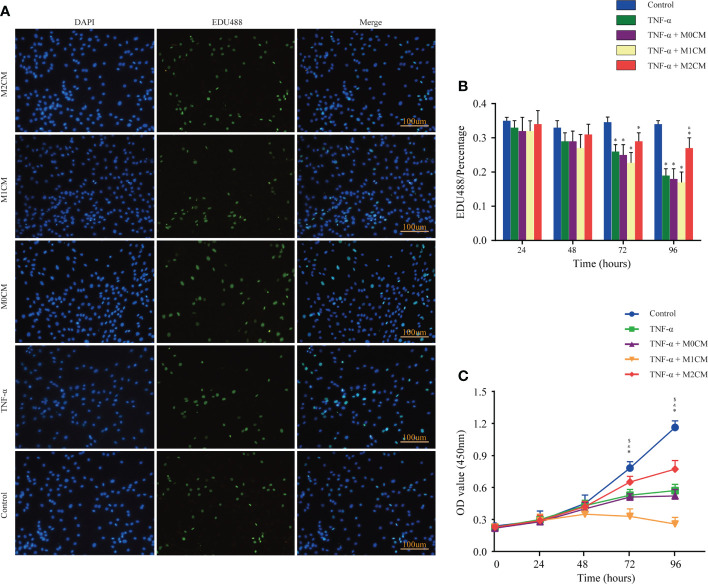
Figure 2.
| Effect of macrophage polarization on the proliferation of NPCs in the TNF-α-treated environment. (A) Representative images showing EDU incorporation staining of NPCs in different groups. (B) Comparison of EDU positive staining ratios corresponding to different test compounds at different time points. (C) Comparison of OD values corresponding to different test compounds at different time points based on cell proliferation assays. Data are expressed as the mean ± SD (n = 4). *, significant difference between the control and TNF-α-treated groups at P < 0.05; $, significant difference between the TNF-α- and M1CM+ TNF-α-treated groups at P < 0.05; &, significant difference between the TNF-α- and M2CM+ TNF-α-treated groups at P < 0.05. NPCs, nucleus pulposus cells; TNF-α, tumor necrosis factor-α.

