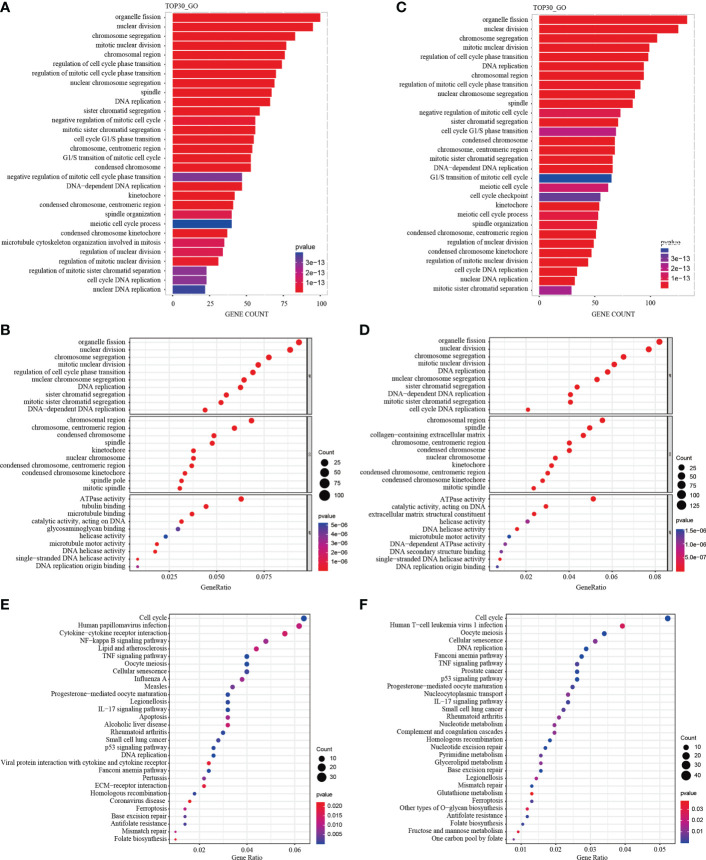
Figure 7.
GO functional and KEGG pathway enrichment analysis of differentially expressed genes (DEGs) in M1CM or M2CM treated NPCs. The GO terms and KEGG pathway names are shown on the y-axis. Top 30 most significantly enriched GO terms of NPCs treated with M1CM (A) or M2CM (C) are displayed in a GO functional enrichment strip map. The length of the bars on the x-axis represents the gene counts, and the GO terms are shown on the y-axis. The bubble chart of the top 10 most significantly enriched GO terms of NPCs treated with M1CM (B) or M2CM (D) are displayed in terms of BPs, MF and CCs respectively. The x-axis represents the gene proportion in the annotation pathway, and the y-axis represents the GO terms. The color is determined by the P value, and the size is determined by the number of genes in the annotation pathway. (E, F) KEGG function enrichment bubble chart. The x-axis represents the ratio of genes in the annotation pathway, and the y-axis represents the KEGG pathway, the color is determined by the P value, and the size is determined by the number of genes in the annotation pathway.

