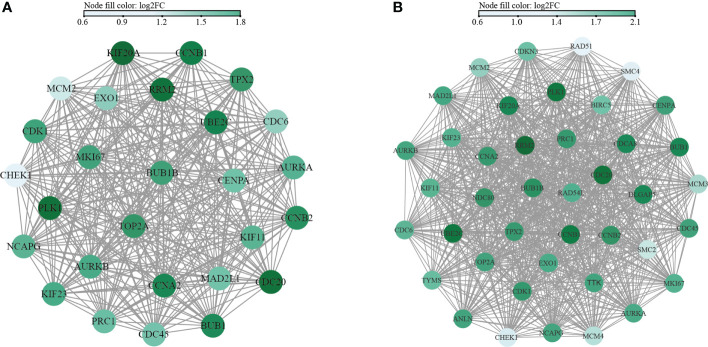
Figure 8.
Network interaction diagram of hub genes in M1CM (A) and M2CM (B) groups. The nodes represent the hub genes, and the edges represent the protein protein interaction. The color is determined by the results of the six indicators from large to small, and the greater the score, the darker is the color.

