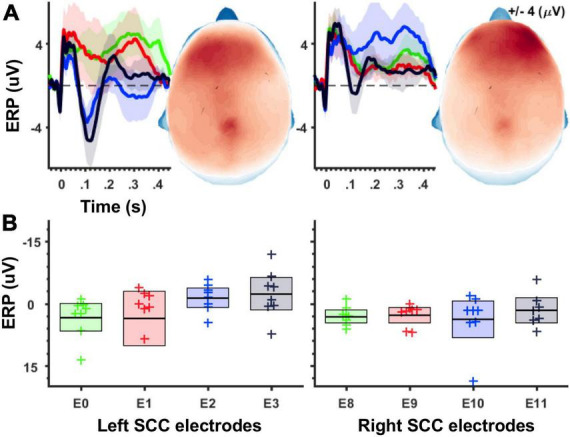
FIGURE 2.

Magnitude of unilateral stimulation evoked potentials increases along the ventral-to-dorsal axis of the SCC target region. (A) Grand average waveforms for stimulation-evoked potentials. Shaded areas depict 95% confidence intervals after 1,000 bootstraps. Left panel shows ERPs following left SCC stimulation, and right panel shows ERPs following right SCC stimulation. Topographic plots show ERP magnitude integrated over 50–150 ms time window. (B) Boxplots depicting average ERP amplitudes (averaged across 50–150 ms, electrode montage shown in Figure 1C) separately for stimulation location. Left panel shows averages for left-SCC stimulation, right panel shows averages for right-SCC stimulation.
