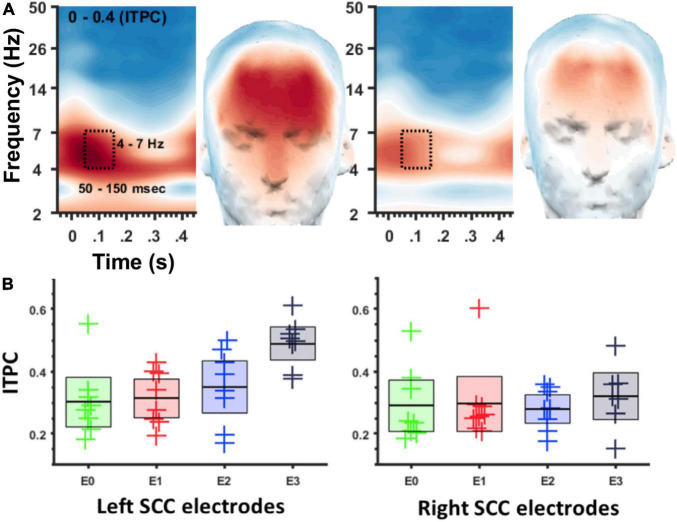
FIGURE 3.
ITPC at 4–7 Hz depends on location of DBS in the SCC region. (A) Spectrogram of ITPC across time and frequency. Box denotes time-frequency region-of-interest used for topographic plots. Left panel for left SCC stimulation, right panel for right SCC stimulation. (B) Box plots showing ITPC (50–150 ms, 4–7 Hz) at different stimulation locations. Left panel for left SCC stimulation, right panel for right SCC stimulation. Green = E0/8, Red = E1/9, Blue = E2/10, Black = E3/11.

