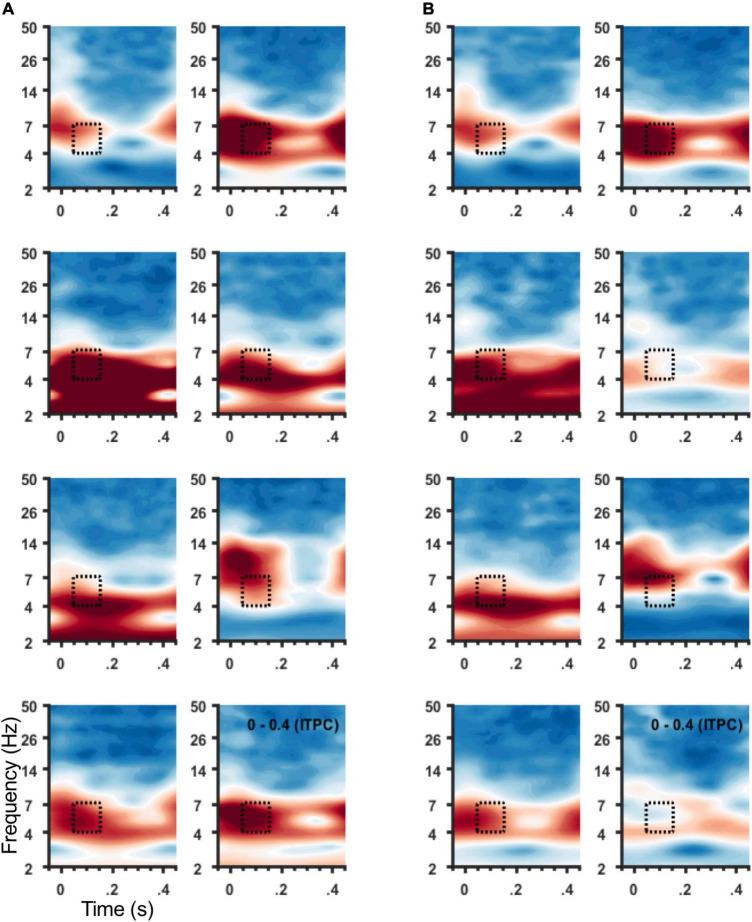
FIGURE 4.
ITPC at 4–7 Hz for individual participants. Spectrograms of average ITPC across all stimulation locations from frontal sensors (Figure 1C) for individual participants. Subject order (1–8) shown within panel: right to left column then top to bottom row. (A) Spectrograms show ITPC time-locked to left hemisphere SCC DBS, and (B) to right hemisphere SCC DBS. Stippled box denotes time-frequency region of interest used for group analysis and topographic plots in (B).

