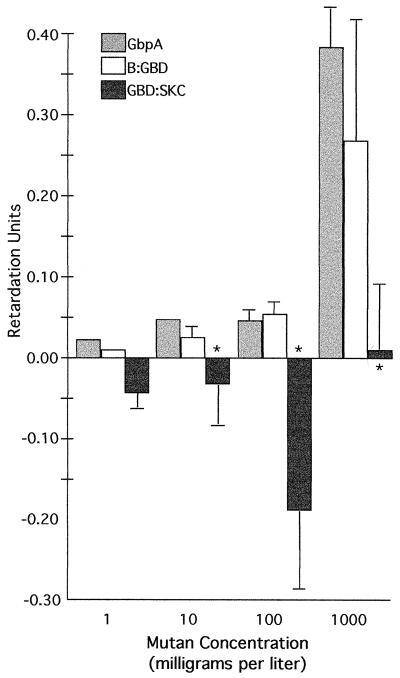
FIG. 3.
Binding of GbpA, B-GBD, and GBD-SKC to various concentrations of mutan in the gel retardation assay. Purified proteins or cellular lysates containing the protein of interest were run on native gels containing different amounts of mutan. Proteins were blotted onto nitrocellulose and stained with an anti-GBD antibody. RU were calculated as described in the text. The asterisks indicate that the migration of GBD-SKC was reduced significantly compared to those of both GbpA and B-GBD (except at a mutan concentration of 10 mg/liter, where the standard deviation of GbpA was zero and therefore could not be statistically tested), based on a Student t test (P, <0.03). The migration of GbpA and that of B-GBD did not differ statistically. Error bars show standard deviations.

