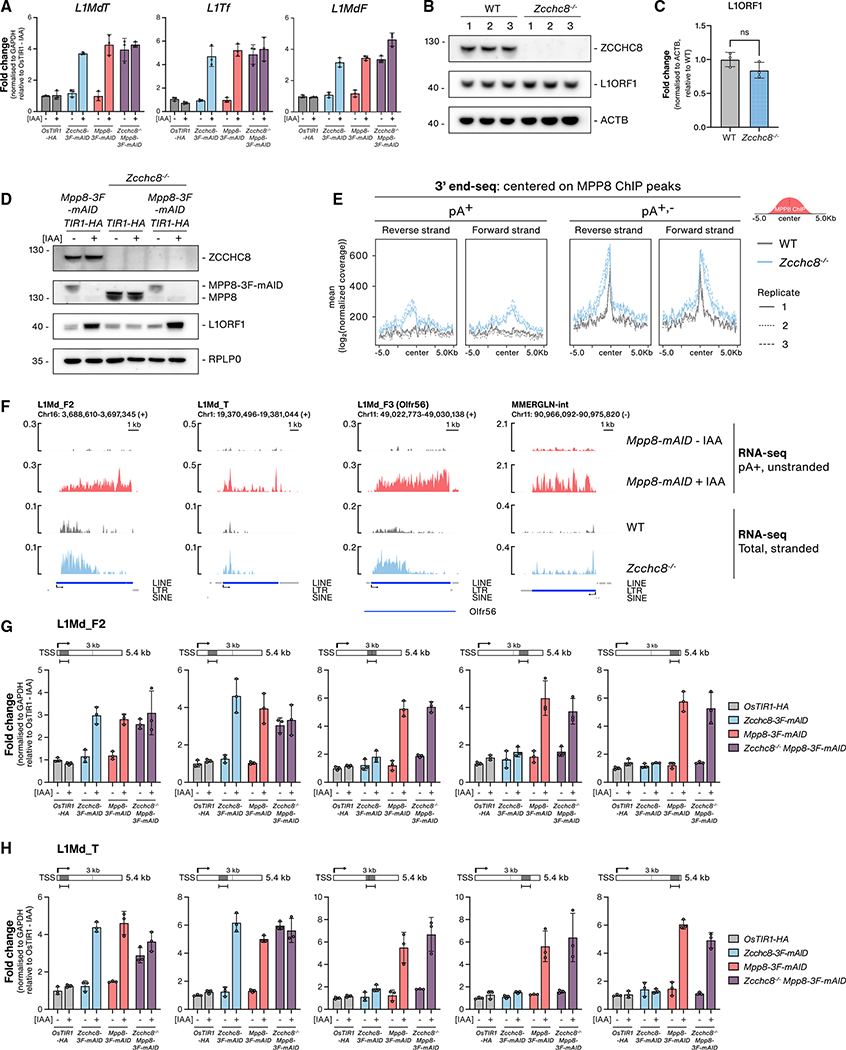
Figure 5. NEXT and HUSH suppress non-polyadenylated and polyadenylated TE RNAs, respectively.
(A) qRT-PCR analysis of L1 LINE transcripts from total RNA harvested from OsTIR1-HA, Zcchc8–3F-mAID, Mpp8-3F-mAID, or Zcchc8−/− Mpp8-3F-mAID cell lines either mock or IAA treated (72 h). Data representation as in Figure 1H.
(B) WB analysis of lysates from three biological WT replicates and three Zcchc8−/− clonal cell lines. Membranes were probed with antibodies against ZCCHC8, L1ORF1 and Actin (ACTB, loading control).
(C) Quantification of L1ORF1 protein levels from the WB in (B). Data show the average value from three replicates, normalized to ACTB levels and plotted as the fold change relative to WT samples. Statistical significance was assessed as in Figure 4C.
(D) WB analysis of Mpp8-3F-mAID, Zcchc8−/−, and Zcchc8−/− Mpp8-3F-mAID cell extracts following either mock or IAA treatment (72 h). Membranes were probed with antibodies against ZCCHC8, MPP8, L1ORF1, and RPLP0 (loading control).
(E) Metagene profiles of 3′ end-seq signals from pA+ and pA+,− 3′ end-seq libraries of WT or Zcchc8−/− cells and displayed within a 10 kb window centered on MPP8 ChIP-seq peaks. Forward and reverse strands are plotted independently with replicates plotted separately as indicated in the legend.
(F) Genome browser tracks of example upregulated L1 LINEs and LTR RNAs from RNA-seq data generated upon MPP8 or ZCCHC8 depletion. Data from Mpp8-mAID samples, either mock or IAA treated (48 h), are from pA+ selected, un-stranded libraries. Data from WT and Zcchc8−/− cells are from rRNA-depleted, stranded libraries with the relevant strand data represented here. Annotations are displayed as in Figure 1F.
(G) qRT-PCR analysis of L1Md_F transcripts from total RNA harvested from samples described in (A). Amplicons were designed to amplify either 5′, center, or 3′ regions of the L1Md_F2 LINE transcript as indicated in the schematics
(H) As in (G) but for L1Md_T transcripts.

