
Figure 1.
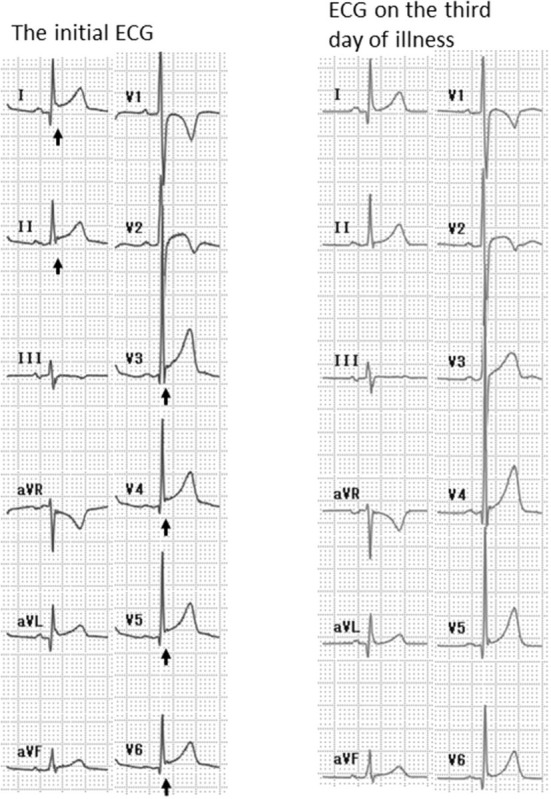
Electrocardiogram (ECG) of Patient 5. The initial ECG showed ST-segment elevation in leads I, II, and V3–6 (arrows). The ECG on the third day of illness was normal.
Official websites use .gov
A
.gov website belongs to an official
government organization in the United States.
Secure .gov websites use HTTPS
A lock (
) or https:// means you've safely
connected to the .gov website. Share sensitive
information only on official, secure websites.
Electrocardiogram (ECG) of Patient 5. The initial ECG showed ST-segment elevation in leads I, II, and V3–6 (arrows). The ECG on the third day of illness was normal.