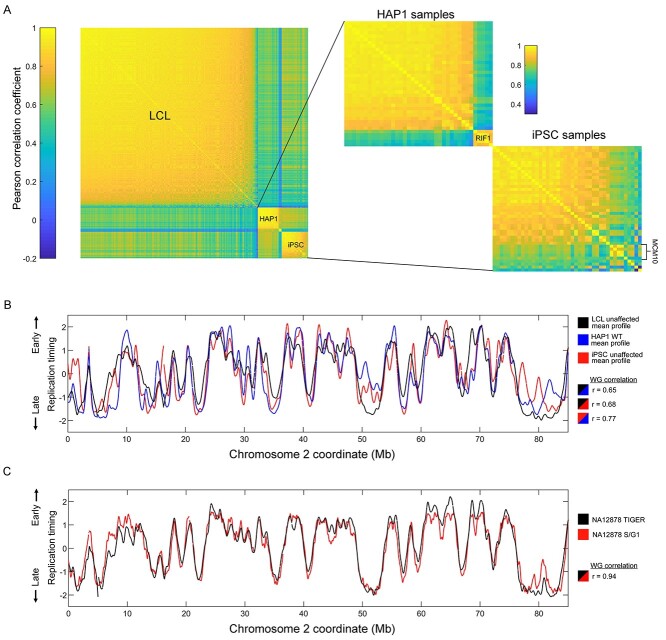
Figure 1.
Overview of replication timing data. (A) Correlation matrices of replication profiles for all samples. (B) Replication profiles and whole genome correlations of the WT/unaffected mean profiles of the different cell types. (C) Replication timing profile comparison and whole genome correlation for the sample NA12878 generated with TIGER (see Materials and Methods) or S/G1 sequencing.

