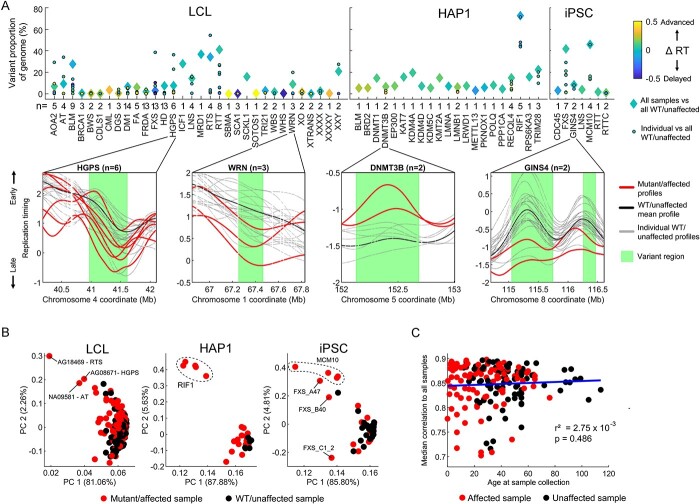
Figure 2.
Analysis of variance detects significant replication timing variation in all mutated gene groups and most individual samples. (A) Top: Proportion of the autosomal genome with variant replication timing detected via ANOVA with a Bonferroni-corrected P-value of <0.05. For each mutated gene, both grouped and individual samples were evaluated against WT/unaffected samples for each cell type. Colors represent the extent of bias toward replication timing advances or delays. The total number of mutant/affected samples is noted for each gene. Bottom: four example gene mutations are shown, with variant regions depicted based on the grouped analysis. For LCL samples, only 20 unaffected samples are shown. (B) PCA of the entire autosomal replication timing profiles. Clustering by mutation is observed for the RIF1 KO in HAP1 cells and for samples with mutated MCM10 in iPSCs. (C) Relationship of individual donor age at sample collection to median correlation of autosomal replication timing among LCL samples. Only samples with a mean correlation >0.7 to other LCL samples are included (see Materials and Methods and Supplementary Material, Fig. S5B for all samples).

