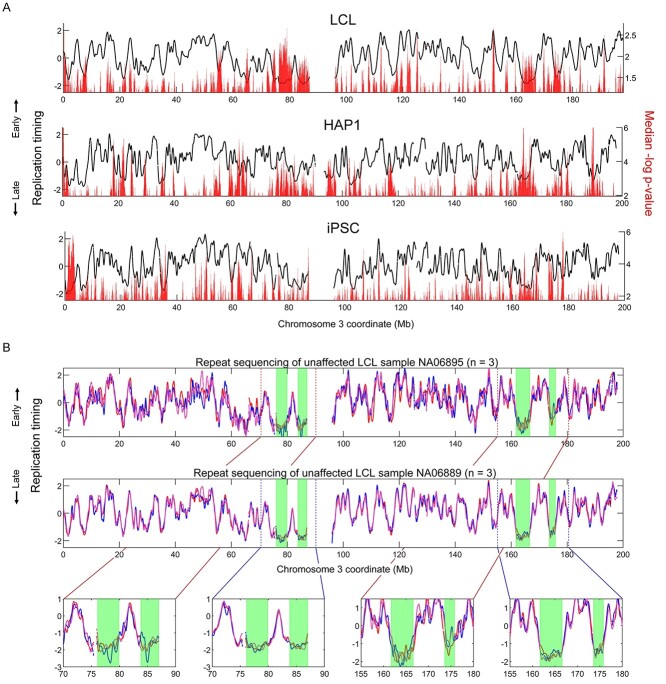
Figure 4.
Localized variability in replication timing. (A) The median P-value in each sliding window across 1000 simulations using all mutant/affected group sizes tested against the total number of WT/unaffected samples available for each cell type (137 for LCL, 6 for HAP1 and 24 for iPSCs). Only P-values below the median are shown. (B) Replication timing of the LCL unaffected samples NA06895 and NA06889 (each of which includes three repetitions). Late-replicating regions with notable variation are highlighted in green.

