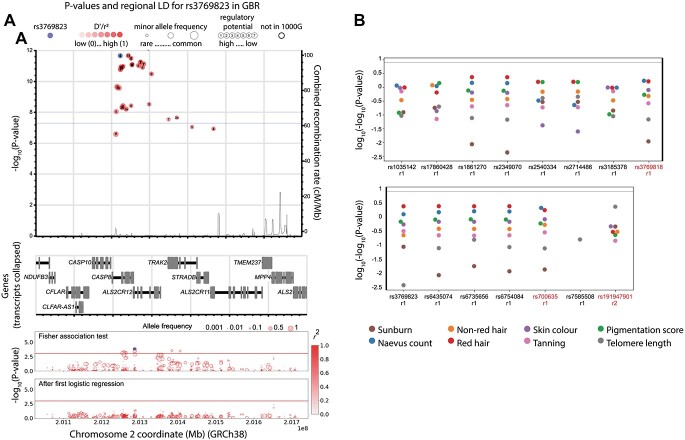
Figure 5.
Association of variants in the CASP8 region with melanoma melanoma-linked phenotypes and survival. (A) The top panel shows the combined recombination rate from HapMap and the −log10(P value) of association with melanoma for those variants most strongly associated (P value 1 × 10⁻⁷) from the most recent melanoma meta-analysis (4) as well as the combined recombination rate from HapMap (50). Numbers inside the circles hold regulatory information (if any) from RegulomeDB (49), the circle size represents the minor allele frequency. The purple dot corresponds to rs3769823, the red shade depicts the linkage disequilibrium (r2) value with respect to it. The horizontal blue line indicates P = 5 × 10⁻⁸. The genes in the genomic region are depicted in the middle panel. These panels were interactively plotted by LDassoc (https://ldlink.nci.nih.gov/) (51). The results of the association tests and logistic regression in the melanoma cohort in this study are shown in the lower panel. The colour of the circle represents the linkage disequilibrium (r2) value with respect to the most associated variant, and the circle size represents the allelic frequency of the minor allele. (B) P-value of association tests of all melanoma-associated variants with distinct melanoma-related phenotypes. r1 and r2 represent distinct haplotypes. The gray line represents P value = 1 × 10⁻⁸.

