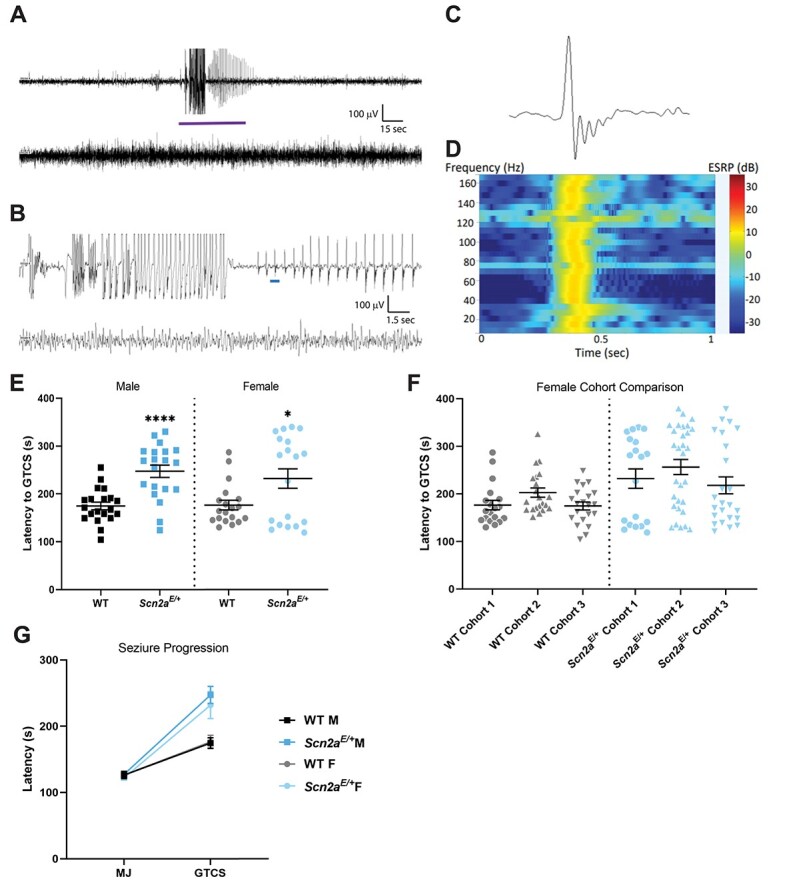
Figure 7.

EEG abnormalities and altered susceptibility to induced seizures in Scn2aE/+ mice. (A) Representative 5 min epoch of EEG from Scn2aE/+ mice. A localized seizure occurred as an abrupt onset of rhythmic 2 Hz sharp waves with overriding fast activity that evolve in amplitude and frequency for ~45 s before abruptly terminating with return to typical sleep background, and (B) 30-s epoch corresponding to the purple bar segment from (A). The top line in both (A) and (B) corresponds to channel 1 (right posterior-left posterior) and second line is channel 2 (right anterior-left posterior). (C) Example of an isolated high amplitude sharp wave with overriding fast activity corresponding to the blue bar segment in (B). (D) Power spectrum for the sharp wave in (C) showing elevated power in decibels across the 1–170 Hz frequency range at the time of discharge. (E) Latency to flurothyl-induced GTCS in Scn2aE/+ mice compared with WT at 6–9 weeks of age. Scn2aE/+ males had an elevated threshold for flurothyl-induced seizures compared with WT (WT: 175 ± 8 s, Scn2aE/+: 247 ± 13 s, ****P < 0.0001; Welch’s t-test). Scn2aE/+ females also had an elevated threshold for flurothyl-induced seizures compared with WT (WT: 177 ± 10 s, Scn2aE/+: 232 ± 20 s, *P = 0.0282; Kolmogorov–Smirnov test). Symbols represent samples from individual mice, horizontal lines represent mean and error bars represent SEM. (F) Latency to first flurothyl-induced generalized tonic–clonic seizure (GTCS) in WT and Scn2aE+ female mice across multiple cohorts (n = 19–30 per genotype and cohort). Cohorts were evaluated at different times. Data from Scn2aE/+ females is abnormally distributed in all three cohorts compared with cohort-matched WT controls. (G) Average latency to first myoclonic jerk (MJ) and GTCS, with connecting line depicting time of progression between stages. There was no genotype difference in latency to first MJ for both sexes (Table 2). However, progression between stages was slower for both male and female Scn2aE/+ mice compared with WT (Males: P < 0.0001; Mann–Whitney test; Females: P = 0.0350, Kolmogorov–Smirnov test). Symbols represent group mean and error bars represent SEM; n = 19–20/sex/genotype Males and females were analyzed separately.
