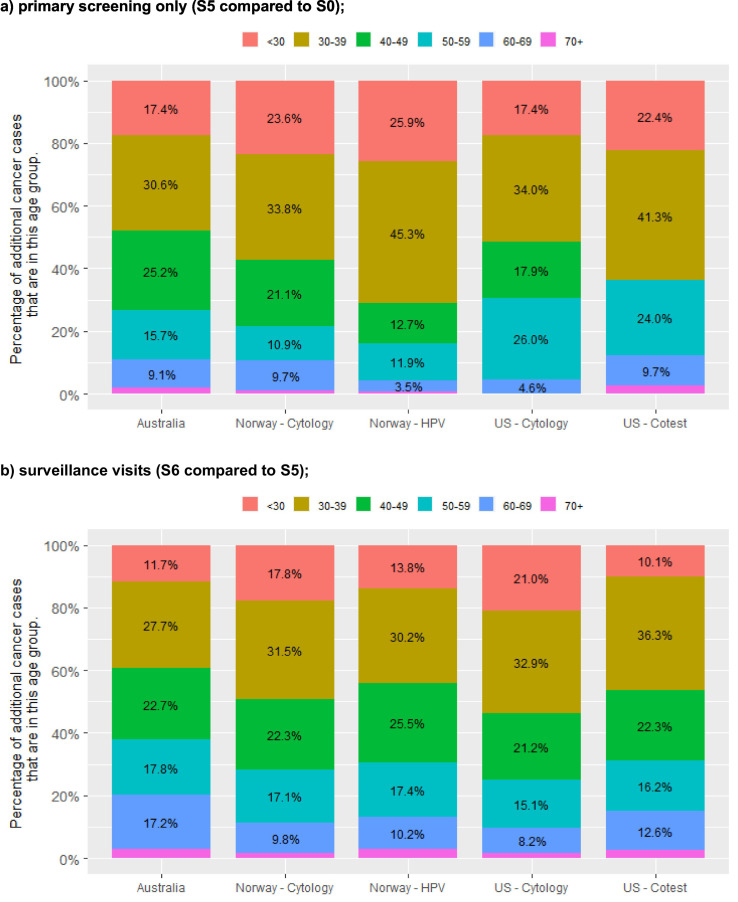
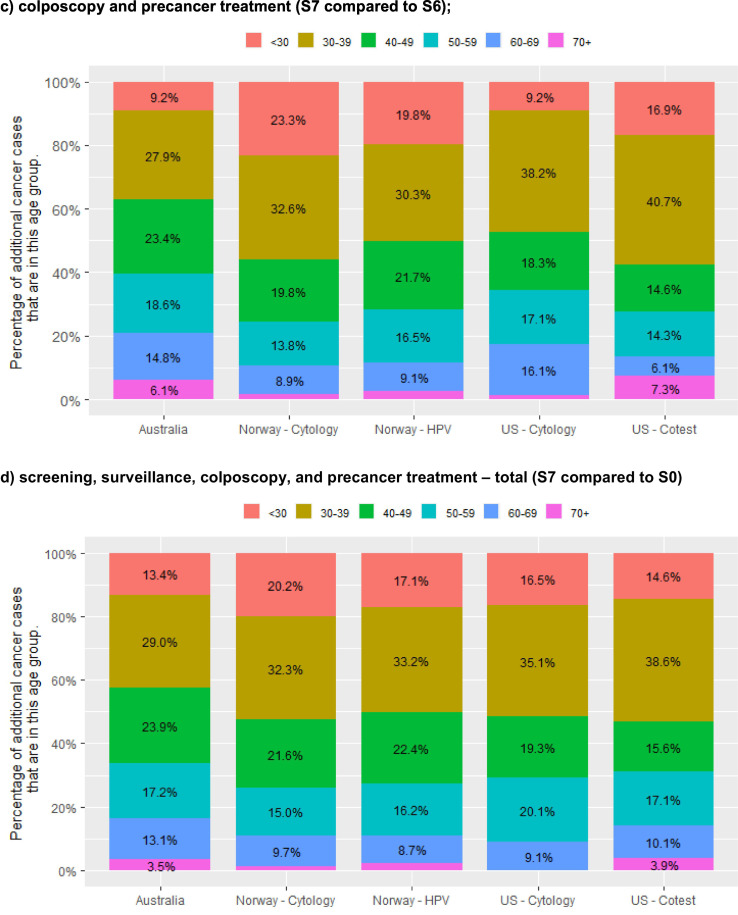
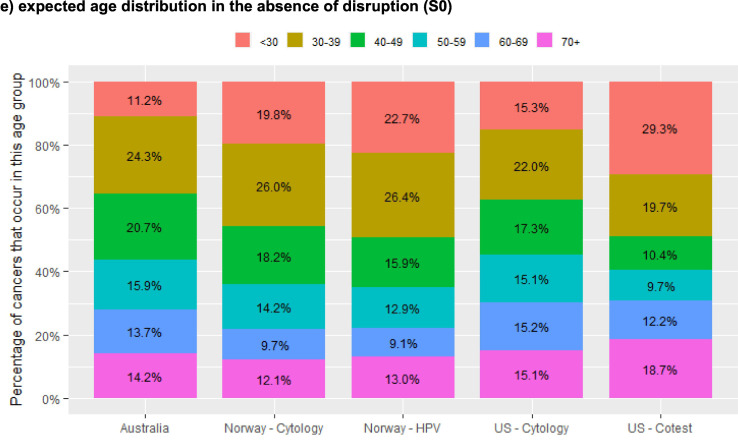
Fig. 2.
percentage of additional cancer cases over 2020–2030 in each age group*, by setting and extent of disruption (12-month scenarios).
* Age = age in 2020, not necessarily at the time of cancer diagnosis.
Results for the US represent the midpoint of results for the two included models (Harvard and Policy1-Cervix). Model-specific US results are included in an Appendix (Fig. A4). All Norway models reflect the recommendation that women aged 25–33y be screened with 3y cytology; all US models reflect the recommendation that women aged 21–29y be screened with 3y cytology.


